Prediction Market Taxonomy: 9 Axes Developers Must Track
Prediction Market Taxonomy: 9 Axes Developers Must Track
Prediction Market Taxonomy: 9 Axes Developers Must Track
Classify prediction markets across nine axes, from share structure and trading to resolution, so developers can normalize feeds and interpret signals.

Prediction Market Taxonomy: 9 Axes Developers Must Track
Prediction markets can be analyzed across independent axes, including trading mechanism, share structure, numeraire, and resolution method. Each combination produces distinct liquidity behavior and data requirements, which is why normalizing feeds across venues like Polymarket, Kalshi, and Limitless demands more than matching tickers. Metrics like Loss-Versus-Rebalancing and market-scoring rules only make sense once you know which axis you are measuring.
TL;DR:
Winner take all contracts pay holders of correct outcomes, yes no bundles pair complementary shares, and scalar prices map to ranges rather than probabilities.
Do not compare displayed depth directly: order books show posted orders, while AMM quotes come from a pricing curve and depend on available subsidy.
CDA and LMSR have statistically similar average predictive performance; liquidity conditions and parameter settings, rather than mechanism alone, determine which performs better.
Exclude play money venues from accuracy benchmarks unless the study accounts for weaker external incentives; credits lack the financial stake found in real money markets.
Store canonical identifiers, timestamped trades or AMM curve snapshots, numeraires tagged by market, dispute records, and separate resolution and settlement timestamps.
AssymetrixBuild With Unified Market DataExplore cross-venue prediction market data from Polymarket, Kalshi, and Limitless through a single Data API integration.Explore the Data API
Table of Contents
Taxonomy overview: modular axes and how to combine them
Share structures: WTA, yes-no bundles, scalar, and implementation variants
Money models: real-money vs play-money and numeraire implications
Trading mechanics and liquidity: CDA vs AMM/LMSR, divergence loss, and LVR to monitor
Market resolution and settlement: oracles, arbiters, vote-based and archival consequences
Practical implications: the data fields and signals developers and quants must collect
Case note and pointers to Assymetrix resources for taxonomy-aware data feeds
Author’s take: where to start using the taxonomy in design or research
Assymetrix Data API: unified cross-venue feeds, canonical IDs, and live signals
Sources
Taxonomy overview: modular axes and how to combine them
An academic framework for classifying online prediction markets decomposes a system into independent modules rather than a single label. That structure holds up well for anyone building cross-venue tooling, because it lets you compare systems that look nothing alike on the surface.
The modular axes are:
Infrastructure and permissioning: who can list markets, trade, or access data.
Market topic: the domain a contract covers, from macroeconomics to sports.
Share structure and pricing: how outcomes are represented and priced.
Numeraire: the unit of value settled and traded.
Initialization: how a market is seeded and opened.
Trading: the matching or pricing mechanism in use.
Resolution: how the true outcome gets determined.
Settlement: how winnings get paid out.
Archiving: what happens to market data after close.
Because these axes are independent, a venue using an automated market maker can pair with crowdsourced resolution, while another uses an order book with an arbiter. Reading a market correctly means checking each axis rather than assuming mechanism implies resolution, or that numeraire implies liquidity depth.
Share structures: WTA, yes-no bundles, scalar, and implementation variants
Share structure determines what a trader actually owns and how a dataset should represent it. Winner-take-all (WTA) contracts pay a fixed amount to holders of the correct outcome and nothing to everyone else. Yes-no bundle (YNB) markets, including the YNB-NR variant used in practice, split a binary question into complementary shares that together sum to a fixed value. Scalar markets settle to a point on a numeric range rather than a discrete outcome, which changes how you compute implied probability.
Implementation also varies within each structure:
Splitting (collateral split, automated issuance) creates shares algorithmically and ties displayed liquidity to the pricing curve itself.
Matching (order-book fills) creates shares only when a buyer and seller agree on price, so liquidity reflects standing orders rather than a formula.
Scalar markets often require a different normalization path than binary ones, since “price” maps to a range rather than a probability.
Datasets that blend splitting and matching venues without flagging the distinction will misread displayed depth as comparable, when the two numbers describe different things entirely.
Money models: real-money vs play-money and numeraire implications
Real-money markets settle in a numeraire with external value: US dollars, a stablecoin, or another transferable asset. Play-money markets settle in platform credits that carry no exchange value outside the system. The numeraire shapes participation incentives directly, since traders risking real capital behave differently than traders accumulating points.
That difference shows up in liquidity and in forecasting quality. Real-money venues tend to attract traders with financial skin in the outcome, which generally sharpens price signals, while play-money venues can still generate useful directional signal in low-stakes or experimental settings.
Real-money markets: USD or stablecoin numeraires, direct financial incentive to trade accurately.
Play-money markets: platform credits, lower barrier to entry, weaker external validity.
Mixed research use: exclude play-money venues from accuracy benchmarks unless the study design accounts for incentive differences explicitly.
Trading mechanics and liquidity: CDA vs AMM/LMSR, divergence loss, and LVR to monitor
Continuous double auction (CDA) venues match buy and sell orders directly against a standing order book, so liquidity depends entirely on what traders have posted. Automated market maker and market-scoring-rule systems, including LMSR, instead price trades against a formula, which guarantees a quote at any size but ties liquidity to the subsidy behind the curve.
Comparative research on CDA and LMSR finds the two mechanisms produce statistically similar average predictive performance, though superiority depends heavily on liquidity conditions and parameter settings rather than the mechanism alone.
CDA liquidity: order-book depth, visible bid-ask spread, sensitive to trader participation.
AMM/LMSR liquidity: constant by design, but exposed to subsidy drawdown as volume grows.
Divergence loss: a risk specific to splitting-based AMMs, where share creation through collateral splitting can erode the value backing the pool.
LVR (Loss-Versus-Rebalancing): a monitoring metric for quantifying how much an AMM loses relative to a continuously rebalanced benchmark.
Treat displayed AMM liquidity as a statement of algorithmic commitment, not a resting limit order, when sizing a position or backtesting a strategy against liquidity depth data.
Pro Tip: Track LVR alongside raw spread when comparing venues, since a tight quoted spread on a thin AMM can still carry meaningful rebalancing cost that a CDA spread never shows.
Market resolution and settlement: oracles, arbiters, vote-based and archival consequences
Resolution design determines how a market learns its own outcome, and the mechanism varies widely across venues. Common patterns include a designated arbiter who rules on the outcome, network reporters who submit attestations, crowdsourced voting among token or reputation holders, optimistic resolution that assumes a proposed outcome unless challenged, and oracle integrations that pull from external data feeds.
Arbiter-based: fast but centralized, with dispute risk concentrated in one party.
Crowdsourced or optimistic: slower to finalize, but resistant to single-point manipulation.
Push settlement pays out automatically once resolution finalizes; pull settlement requires the trader to claim winnings, which affects when a position actually closes in your records.
For backtesting, resolution delays and post-resolution amendments matter as much as the headline outcome. A market that resolves, gets disputed, and later flips introduces a data quality problem that archiving policy either preserves or erases.
Practical implications: the data fields and signals developers and quants must collect
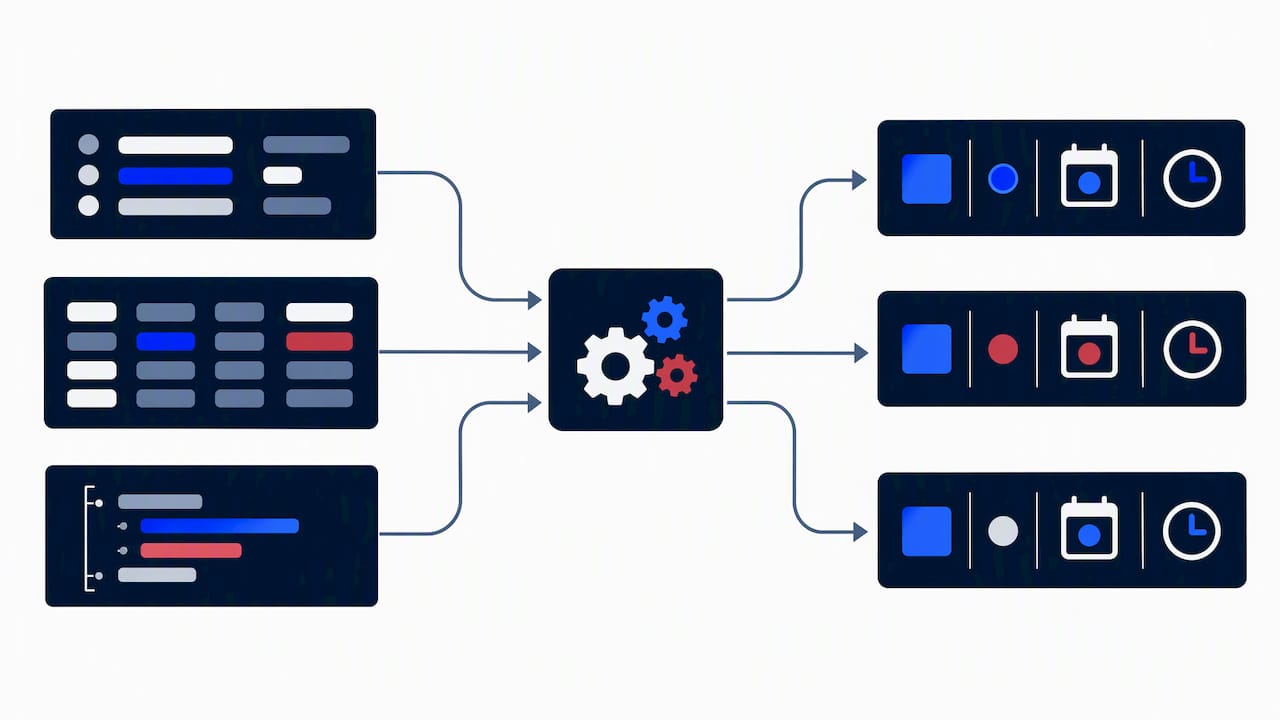
Taxonomy only earns its keep once it is operationalized into a schema. A normalized feed across venues needs a consistent set of fields regardless of which axis combination a given market uses.
Canonical market and outcome identifiers, consistent across venues and resilient to renaming.
Timestamped fills and orders for CDA venues, or AMM curve state snapshots for market-maker venues.
Numeraire and denomination, tagged per market rather than assumed per venue.
Resolution metadata, including method, resolver identity, and dispute status.
Settlement timestamps, separated from resolution timestamps where push and pull flows differ.
From those fields, the signals worth deriving include liquidity depth, bid-ask spread, trade counts, price variance over time, smart-money wallet traces, cross-venue arbitrage gaps, and LVR for AMM-based markets.
Pro Tip: Align timestamps to a single clock source before joining feeds across venues, since resolution and settlement events on different mechanisms rarely land on the same cadence.
Integration work mostly comes down to canonical identifiers, consistent quality flags for amended resolutions, and a clear separation between resolution time and settlement time in every stored record.
Case note and pointers to Assymetrix resources for taxonomy-aware data feeds
A common integration problem surfaces when combining AMM-based and order-book venues into one dataset: displayed liquidity numbers look comparable but describe different underlying mechanics, which skews naive depth comparisons until the axes are separated explicitly.
Resources that speed this work include the cross-venue canonical ID guide, the real-time and historical API guide, and writeups on arbitrage signal construction. Each one reduces the normalization work a team would otherwise rebuild from scratch per venue.
Author’s take: where to start using the taxonomy in design or research
For market design work, start with the trading mechanism axis, since it sets the liquidity behavior everything else depends on. For research work comparing venues, start with resolution, since inconsistent resolution handling quietly corrupts more backtests than mechanism choice does. Either way, instrument LVR and liquidity depth from day one rather than retrofitting them later.
— Dean
Assymetrix Data API: unified cross-venue feeds, canonical IDs, and live signals
Our Data API delivers canonical market identifiers, live and historical feeds, and liquidity and wallet signals across Polymarket, Kalshi, and Limitless through a single integration.

Canonical IDs resolve the identifier mismatch between venues before you write a line of strategy code.
Historical data supports backtesting resolution and liquidity assumptions.
Smart Money and arbitrage signals support taxonomy classification and signal generation.
Check field definitions and get started on the Data API page.
FAQ
What are the main axes used to classify prediction markets?
Prediction markets are classified along independent axes: trading mechanism, share structure, numeraire, and resolution method, with infrastructure, initialization, settlement, and archiving as supporting dimensions in the modular taxonomy. Each axis can combine freely with the others, so two markets sharing a mechanism can still differ completely in resolution or numeraire.
Is LMSR or a continuous double auction more accurate?
Neither mechanism wins outright. Comparative research finds CDA and LMSR produce statistically similar average predictive performance, with the better performer depending on liquidity conditions and parameter settings rather than the mechanism itself.
What is divergence loss in an AMM-based prediction market?
Divergence loss describes value erosion in splitting-based automated market makers, where share creation through collateral splitting can introduce risk roughly equivalent to the liquidity committed to the pool. It is distinct from order-book slippage, since it arises from the pricing curve rather than from matching trades against standing orders.
Should researchers include play-money markets in cross-venue studies?
Play-money markets generally carry weaker external validity than real-money markets because participants have no financial stake in the outcome. Researchers typically exclude play-money venues from accuracy benchmarks unless the study design explicitly accounts for the incentive difference.
What data fields do I need to normalize across prediction market venues?
A workable cross-venue schema needs canonical market and outcome identifiers, timestamped fills or AMM curve state, tagged numeraire, resolution metadata, and settlement timestamps kept separate from resolution timestamps. These fields let you derive liquidity depth, spreads, and arbitrage signals consistently regardless of which mechanism a given market uses.
Sources
The classification framework here draws on a foundational academic taxonomy for online prediction markets, which established the modular, axis-based approach to comparing disparate systems. Mechanism trade-offs draw on comparative research measuring CDA against LMSR performance, and on practitioner-level microstructure analysis covering divergence loss and LVR in decentralized prediction market AMMs. Together they cover the academic systematization, the mechanism comparison, and the microstructure detail a developer or quant needs to apply the taxonomy in practice.
Prediction Market Taxonomy: 9 Axes Developers Must Track
Prediction markets can be analyzed across independent axes, including trading mechanism, share structure, numeraire, and resolution method. Each combination produces distinct liquidity behavior and data requirements, which is why normalizing feeds across venues like Polymarket, Kalshi, and Limitless demands more than matching tickers. Metrics like Loss-Versus-Rebalancing and market-scoring rules only make sense once you know which axis you are measuring.
TL;DR:
Winner take all contracts pay holders of correct outcomes, yes no bundles pair complementary shares, and scalar prices map to ranges rather than probabilities.
Do not compare displayed depth directly: order books show posted orders, while AMM quotes come from a pricing curve and depend on available subsidy.
CDA and LMSR have statistically similar average predictive performance; liquidity conditions and parameter settings, rather than mechanism alone, determine which performs better.
Exclude play money venues from accuracy benchmarks unless the study accounts for weaker external incentives; credits lack the financial stake found in real money markets.
Store canonical identifiers, timestamped trades or AMM curve snapshots, numeraires tagged by market, dispute records, and separate resolution and settlement timestamps.
AssymetrixBuild With Unified Market DataExplore cross-venue prediction market data from Polymarket, Kalshi, and Limitless through a single Data API integration.Explore the Data API
Table of Contents
Taxonomy overview: modular axes and how to combine them
Share structures: WTA, yes-no bundles, scalar, and implementation variants
Money models: real-money vs play-money and numeraire implications
Trading mechanics and liquidity: CDA vs AMM/LMSR, divergence loss, and LVR to monitor
Market resolution and settlement: oracles, arbiters, vote-based and archival consequences
Practical implications: the data fields and signals developers and quants must collect
Case note and pointers to Assymetrix resources for taxonomy-aware data feeds
Author’s take: where to start using the taxonomy in design or research
Assymetrix Data API: unified cross-venue feeds, canonical IDs, and live signals
Sources
Taxonomy overview: modular axes and how to combine them
An academic framework for classifying online prediction markets decomposes a system into independent modules rather than a single label. That structure holds up well for anyone building cross-venue tooling, because it lets you compare systems that look nothing alike on the surface.
The modular axes are:
Infrastructure and permissioning: who can list markets, trade, or access data.
Market topic: the domain a contract covers, from macroeconomics to sports.
Share structure and pricing: how outcomes are represented and priced.
Numeraire: the unit of value settled and traded.
Initialization: how a market is seeded and opened.
Trading: the matching or pricing mechanism in use.
Resolution: how the true outcome gets determined.
Settlement: how winnings get paid out.
Archiving: what happens to market data after close.
Because these axes are independent, a venue using an automated market maker can pair with crowdsourced resolution, while another uses an order book with an arbiter. Reading a market correctly means checking each axis rather than assuming mechanism implies resolution, or that numeraire implies liquidity depth.
Share structures: WTA, yes-no bundles, scalar, and implementation variants
Share structure determines what a trader actually owns and how a dataset should represent it. Winner-take-all (WTA) contracts pay a fixed amount to holders of the correct outcome and nothing to everyone else. Yes-no bundle (YNB) markets, including the YNB-NR variant used in practice, split a binary question into complementary shares that together sum to a fixed value. Scalar markets settle to a point on a numeric range rather than a discrete outcome, which changes how you compute implied probability.
Implementation also varies within each structure:
Splitting (collateral split, automated issuance) creates shares algorithmically and ties displayed liquidity to the pricing curve itself.
Matching (order-book fills) creates shares only when a buyer and seller agree on price, so liquidity reflects standing orders rather than a formula.
Scalar markets often require a different normalization path than binary ones, since “price” maps to a range rather than a probability.
Datasets that blend splitting and matching venues without flagging the distinction will misread displayed depth as comparable, when the two numbers describe different things entirely.
Money models: real-money vs play-money and numeraire implications
Real-money markets settle in a numeraire with external value: US dollars, a stablecoin, or another transferable asset. Play-money markets settle in platform credits that carry no exchange value outside the system. The numeraire shapes participation incentives directly, since traders risking real capital behave differently than traders accumulating points.
That difference shows up in liquidity and in forecasting quality. Real-money venues tend to attract traders with financial skin in the outcome, which generally sharpens price signals, while play-money venues can still generate useful directional signal in low-stakes or experimental settings.
Real-money markets: USD or stablecoin numeraires, direct financial incentive to trade accurately.
Play-money markets: platform credits, lower barrier to entry, weaker external validity.
Mixed research use: exclude play-money venues from accuracy benchmarks unless the study design accounts for incentive differences explicitly.
Trading mechanics and liquidity: CDA vs AMM/LMSR, divergence loss, and LVR to monitor
Continuous double auction (CDA) venues match buy and sell orders directly against a standing order book, so liquidity depends entirely on what traders have posted. Automated market maker and market-scoring-rule systems, including LMSR, instead price trades against a formula, which guarantees a quote at any size but ties liquidity to the subsidy behind the curve.
Comparative research on CDA and LMSR finds the two mechanisms produce statistically similar average predictive performance, though superiority depends heavily on liquidity conditions and parameter settings rather than the mechanism alone.
CDA liquidity: order-book depth, visible bid-ask spread, sensitive to trader participation.
AMM/LMSR liquidity: constant by design, but exposed to subsidy drawdown as volume grows.
Divergence loss: a risk specific to splitting-based AMMs, where share creation through collateral splitting can erode the value backing the pool.
LVR (Loss-Versus-Rebalancing): a monitoring metric for quantifying how much an AMM loses relative to a continuously rebalanced benchmark.
Treat displayed AMM liquidity as a statement of algorithmic commitment, not a resting limit order, when sizing a position or backtesting a strategy against liquidity depth data.
Pro Tip: Track LVR alongside raw spread when comparing venues, since a tight quoted spread on a thin AMM can still carry meaningful rebalancing cost that a CDA spread never shows.
Market resolution and settlement: oracles, arbiters, vote-based and archival consequences
Resolution design determines how a market learns its own outcome, and the mechanism varies widely across venues. Common patterns include a designated arbiter who rules on the outcome, network reporters who submit attestations, crowdsourced voting among token or reputation holders, optimistic resolution that assumes a proposed outcome unless challenged, and oracle integrations that pull from external data feeds.
Arbiter-based: fast but centralized, with dispute risk concentrated in one party.
Crowdsourced or optimistic: slower to finalize, but resistant to single-point manipulation.
Push settlement pays out automatically once resolution finalizes; pull settlement requires the trader to claim winnings, which affects when a position actually closes in your records.
For backtesting, resolution delays and post-resolution amendments matter as much as the headline outcome. A market that resolves, gets disputed, and later flips introduces a data quality problem that archiving policy either preserves or erases.
Practical implications: the data fields and signals developers and quants must collect
Taxonomy only earns its keep once it is operationalized into a schema. A normalized feed across venues needs a consistent set of fields regardless of which axis combination a given market uses.
Canonical market and outcome identifiers, consistent across venues and resilient to renaming.
Timestamped fills and orders for CDA venues, or AMM curve state snapshots for market-maker venues.
Numeraire and denomination, tagged per market rather than assumed per venue.
Resolution metadata, including method, resolver identity, and dispute status.
Settlement timestamps, separated from resolution timestamps where push and pull flows differ.
From those fields, the signals worth deriving include liquidity depth, bid-ask spread, trade counts, price variance over time, smart-money wallet traces, cross-venue arbitrage gaps, and LVR for AMM-based markets.
Pro Tip: Align timestamps to a single clock source before joining feeds across venues, since resolution and settlement events on different mechanisms rarely land on the same cadence.
Integration work mostly comes down to canonical identifiers, consistent quality flags for amended resolutions, and a clear separation between resolution time and settlement time in every stored record.
Case note and pointers to Assymetrix resources for taxonomy-aware data feeds
A common integration problem surfaces when combining AMM-based and order-book venues into one dataset: displayed liquidity numbers look comparable but describe different underlying mechanics, which skews naive depth comparisons until the axes are separated explicitly.
Resources that speed this work include the cross-venue canonical ID guide, the real-time and historical API guide, and writeups on arbitrage signal construction. Each one reduces the normalization work a team would otherwise rebuild from scratch per venue.
Author’s take: where to start using the taxonomy in design or research
For market design work, start with the trading mechanism axis, since it sets the liquidity behavior everything else depends on. For research work comparing venues, start with resolution, since inconsistent resolution handling quietly corrupts more backtests than mechanism choice does. Either way, instrument LVR and liquidity depth from day one rather than retrofitting them later.
— Dean
Assymetrix Data API: unified cross-venue feeds, canonical IDs, and live signals
Our Data API delivers canonical market identifiers, live and historical feeds, and liquidity and wallet signals across Polymarket, Kalshi, and Limitless through a single integration.
Canonical IDs resolve the identifier mismatch between venues before you write a line of strategy code.
Historical data supports backtesting resolution and liquidity assumptions.
Smart Money and arbitrage signals support taxonomy classification and signal generation.
Check field definitions and get started on the Data API page.
FAQ
What are the main axes used to classify prediction markets?
Prediction markets are classified along independent axes: trading mechanism, share structure, numeraire, and resolution method, with infrastructure, initialization, settlement, and archiving as supporting dimensions in the modular taxonomy. Each axis can combine freely with the others, so two markets sharing a mechanism can still differ completely in resolution or numeraire.
Is LMSR or a continuous double auction more accurate?
Neither mechanism wins outright. Comparative research finds CDA and LMSR produce statistically similar average predictive performance, with the better performer depending on liquidity conditions and parameter settings rather than the mechanism itself.
What is divergence loss in an AMM-based prediction market?
Divergence loss describes value erosion in splitting-based automated market makers, where share creation through collateral splitting can introduce risk roughly equivalent to the liquidity committed to the pool. It is distinct from order-book slippage, since it arises from the pricing curve rather than from matching trades against standing orders.
Should researchers include play-money markets in cross-venue studies?
Play-money markets generally carry weaker external validity than real-money markets because participants have no financial stake in the outcome. Researchers typically exclude play-money venues from accuracy benchmarks unless the study design explicitly accounts for the incentive difference.
What data fields do I need to normalize across prediction market venues?
A workable cross-venue schema needs canonical market and outcome identifiers, timestamped fills or AMM curve state, tagged numeraire, resolution metadata, and settlement timestamps kept separate from resolution timestamps. These fields let you derive liquidity depth, spreads, and arbitrage signals consistently regardless of which mechanism a given market uses.
Sources
The classification framework here draws on a foundational academic taxonomy for online prediction markets, which established the modular, axis-based approach to comparing disparate systems. Mechanism trade-offs draw on comparative research measuring CDA against LMSR performance, and on practitioner-level microstructure analysis covering divergence loss and LVR in decentralized prediction market AMMs. Together they cover the academic systematization, the mechanism comparison, and the microstructure detail a developer or quant needs to apply the taxonomy in practice.
Other Blog


