Consensus Odds Calculation for Developers: No Vig, API Snapshots
Consensus Odds Calculation for Developers: No Vig, API Snapshots
Consensus Odds Calculation for Developers: No Vig, API Snapshots
Calculate consensus odds by removing bookmaker margin, comparing pooling methods, and building timestamped API snapshots for prediction market trading.

Consensus Odds Calculation for Developers: No Vig, API Snapshots
Consensus odds calculation pools bookmaker prices at one timestamp into a single probability estimate. Before you bet, strip the vig from every book, pool the normalized probabilities, and compare the result to your own fair probability or to public betting percentages. Large divergences and sharp line moves carry the strongest signal.
TL;DR:
Use the median when quotes conflict; inspect extreme prices if arithmetic and log odds estimates differ by more than a point or two.
Ticket share counts bets, while handle share counts dollars; trust handle more in liquid markets, but favor bookmaker consensus when markets are small and illiquid.
Home outcomes whose odds fell more than 10% outperformed those whose odds rose by 13.83 percentage points, but movement may reflect bookmaker risk management.
Treat binary prediction market prices as probabilities without removing a bookmaker margin, but verify prices sum near 1.0 and inspect spread, depth, and trade recency.
For cross venue pooling, match canonical event IDs and settlement conditions, align timestamps, and store each venue’s contribution so the result can be audited.
Assymetrixdata.assymetrix.comBuild Cross-Venue Consensus With Unified DataAssymetrix brings prediction market data from Polymarket, Kalshi, and Limitless into one API for consensus snapshots and analysis.Explore the Data API
Table of Contents
How do you convert odds to implied probability and remove the vig?
Which methods compute consensus odds best?
What does a worked consensus calculation look like?
How does consensus differ from public betting percentages?
How do consensus trends and line movement create value?
How do you build a consensus pipeline with APIs and snapshots?
How should you read consensus odds in prediction markets versus sportsbooks?
How do you integrate cross-venue prediction market data into a consensus?
How do you find arbitrage using consensus odds in prediction markets?
How do you measure the reliability and variability of consensus odds?
How do Smart Money and trader skill scores adjust consensus odds?
What should a developer and trader checklist include?
How we help you implement consensus snapshots
Sources
How do you convert odds to implied probability and remove the vig?
Every consensus method starts from implied probability, so get these conversions right first.
Decimal odds: implied probability = 1 / decimal odds.
American odds, positive (+150): decimal = 1 + (odds / 100).
American odds, negative (-150): decimal = 1 + (100 / |odds|).
Overround: the sum of 1/odds across all outcomes in a market. Anything above 1.0 is bookmaker margin.
No-vig probability: each outcome’s inverse odds divided by the overround.
For a two-way market, convert each price to decimal odds, calculate the raw implied probabilities, and divide each by their sum to remove the overround. The resulting no-vig probabilities sum to 1.0.
Skip this step and every pooled number is inflated by margin, so the consensus runs systematically off the true price. Sportsbook commission also matters for edge sizing: a statistical theory of sports betting shows that estimating quantiles near the median is central to wagering decisions, and that small deviations of 1–3 points can permit positive expected profit under realistic commission assumptions.
Which methods compute consensus odds best?
Five approaches cover most practical needs. Pick by how much your book sample disagrees and how much reliability data you hold.
Arithmetic average: the mean of no-vig probabilities. Simple, but a single stale or mispriced book drags it.
Median: robust when books disagree, and often the safer default for thin markets.
No-vig (fair) pooling: normalize every book first, then pool. This is a precondition for the other methods, not an alternative to them.
Weighted pooling: weight books by liquidity, recency of quote, or verified reliability. Treat the weights as hypotheses you test, not facts.
Log-odds pooling: convert each probability to z = ln(p/(1-p)), average z, then convert back. Because probabilities are non-linear, pooling on log-odds (the geometric mean of odds ratios) avoids underconfidence and handles extreme probabilities better than a straight average.
Pro Tip: Compute both the arithmetic and log-odds consensus on every market. When they diverge by more than a point or two, a quote at the extremes is usually driving it, and that is the book to inspect.
What does a worked consensus calculation look like?
Illustrative inputs: three books quote the same two-way moneyline at one timestamp. Book A has -150 / +130, Book B has -140 / +120, Book C has -160 / +140.
Convert the favorite side to implied probability: Each book’s favorite-side implied probability is calculated from its quoted odds.
Convert the underdog side: Calculate each book’s underdog-side implied probability and overround from its quoted odds.
Normalize the favorite: Normalize each book’s favorite-side probability by its overround.
Calculate the arithmetic consensus from the normalized probabilities. For the log-odds consensus, transform each probability to log-odds, average those values, then convert the result back to a probability.
The two methods agree here because the quotes are tightly clustered. They separate when one book sits far from the rest, which is exactly when you want the log-odds figure. If your model and the consensus differ, compare the market price with your estimate before acting. Check the best available price, the liquidity behind it, and how close the snapshot is to the event.
How does consensus differ from public betting percentages?
Consensus odds describe prices. Public percentages describe who is betting. They answer different questions, so use both.
Ticket percentage: the share of individual bets on a side. It tracks how many people like an outcome.
Handle percentage: the share of money wagered. It tracks conviction weighted by bet size.
Why they diverge: multiple accounts inflate tickets, a few large bets dominate handle, time windows differ, and each source samples a different set of books.
Which to trust: in small, illiquid markets a handful of bets can swing either number, so lean on consensus. In liquid markets, handle is the more informative figure.
When divergence is actionable: consensus moves one way while handle runs the other, and the gap persists across snapshots.
Before using any percentage, confirm the contributing book list, the time window, and whether the figure is tickets or handle. A mislabeled metric produces confident wrong conclusions.
How do consensus trends and line movement create value?
Line movement is evidence, not noise. A study of 17,380 football games from 2015 to 2025 found that home outcomes whose odds fell by more than 10% outperformed those whose odds rose by 13.83 percentage points. The same research frames line movement as often reflecting bookmaker risk management rather than absolute truth.
Separate work on real-time betting line movement in Management Science found that forecasts do not always improve closer to game time and that changes are negatively autocorrelated, which sophisticated bettors can exploit. Visibility matters too: lower-visibility NFL games show larger and more frequent line movements because oddsmakers allocate fewer analytical resources.
Read opening versus current: the remaining price after the public has moved the line is what you can actually trade.
Set a threshold: treat moves of 10% or more as a signal worth testing in your own data.
Respect tradability: limits, liquidity and slippage can erase a theoretical edge.
Run a fixed flow: detect the move, compare consensus to fair odds, secure the best price, then size the bet with risk controls.
How do you build a consensus pipeline with APIs and snapshots?
Reproducibility is the whole job. A consensus number you cannot regenerate is a number you cannot audit.
Inputs: canonical event IDs, per-book odds, outcome identifiers and timestamps. Without canonical IDs, joins across venues silently break.
Snapshots: keep an opening snapshot, fixed-interval snapshots and event-triggered snapshots, and retain enough history to roll back and audit.
Fields: odds API documentation describes summary objects with fairOdds, bestOdds and avgOdds, plus snapshot rows carrying avgImpliedProb, fairOdds, bestPrice, bookCount and snapshotAt. These map directly to the normalization and pooling steps above.
Backfill: when a snapshot is missing, carry the last known value forward with a staleness flag rather than interpolating, and align venue timestamps to one clock.
Latency: algorithmic strategies need streaming. Our WebSocket API guide covers live feeds, and our notes on canonical IDs and low-latency pipelines show how a normalized feed removes per-league special-casing.
Pro Tip: Store the book list and snapshot timestamp alongside every consensus value. Six months later, that metadata is the only way to explain why a number changed.
How should you read consensus odds in prediction markets versus sportsbooks?
A sportsbook price embeds margin. A prediction market price is a traded contract, and a contract priced at 0.58 is read directly as a 58% probability, with no overround to strip in a binary market. That makes prediction market prices cleaner inputs to a consensus, but not automatically better ones.
The structural differences matter. Sportsbooks set prices as monopolistic bookmakers, and research cited in the Claremont thesis traces the favorite–longshot bias to markdowns set by price elasticity, which creates different implied margins across favorites and longshots. Prediction markets are order-book driven, so the spread, depth and last-trade recency determine how much a quoted price means. A thin book with a stale last trade is a weak signal even though it carries no vig.
Practical rules follow. Treat prediction market midpoints as already-normalized probabilities, but check that the two sides of a binary market sum close to 1.0 before trusting them. Weight by depth, not just by price. And label the source of every probability in your pool, because a consensus that silently mixes sportsbook no-vig figures with exchange midpoints is hard to interpret and impossible to debug.
When sportsbook consensus and prediction market price disagree, that gap is the object of study. It can reflect different participant pools, different settlement rules, or simple lag, and your pipeline should record which.

How do you integrate cross-venue prediction market data into a consensus?
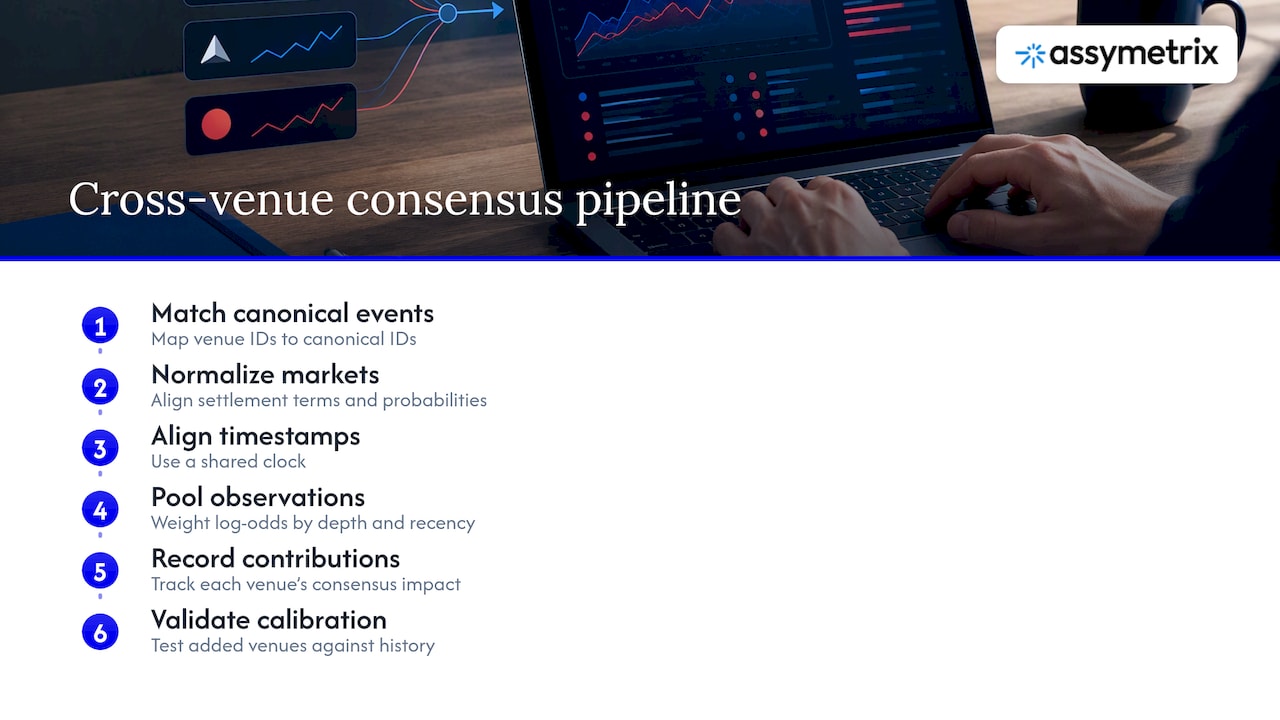
Cross-venue data adds independent observations, and independent observations are what make a consensus more accurate. Polymarket, Kalshi and Limitless each attract different participants, so a pooled price across them dilutes the idiosyncrasies of any single venue.
Start with entity resolution. The same real-world event has a different identifier on every venue, and a consensus is only as good as the matching. Canonical IDs solve this once, upstream, instead of in every strategy. Our guide to shipping sports pipelines with canonical IDs walks through the approach.
Next, normalize semantics. Confirm that contracts resolve on the same condition, since a market that settles on regulation time and one that includes overtime are different questions. Convert every venue’s price to a probability on the same side of the outcome, then align timestamps to a shared clock before pooling.
Then pool with log-odds, weighting by depth and recency. A venue with a deep book and a fresh quote earns more weight than one with a wide spread and an old print. Record the per-venue contribution so you can see which venue moved the consensus.
Finally, validate against history. Our historical data guide for reproducible backtests covers how to test whether adding a venue improved calibration, which is the only honest measure of whether the integration paid off.
How do you find arbitrage using consensus odds in prediction markets?
Consensus gives you a reference price. An arbitrage candidate is a venue quoting meaningfully away from that reference, or a set of contracts whose prices imply probabilities that cannot all be true at once.
Two checks do most of the work. First, compare each venue’s price to the cross-venue consensus. A venue priced well below consensus on one side while another prices the opposite side cheaply may allow a hedge. Second, test internal consistency: in a binary market, the YES and NO prices should cost less than 1.0 combined only when an opportunity exists, and in a multi-outcome market the sum of prices across all outcomes should be checked against 1.0.
A flagged gap is a hypothesis, not a trade. Fees, settlement-rule differences, withdrawal friction and execution risk can consume the apparent edge, and the second leg of a hedge may reprice before you fill it. Depth matters as much as price: a gap that exists only for ten contracts is not scalable.
Timing is the other constraint. Gaps can close quickly, so detection may need to run on streaming data rather than periodic polling. For deeper treatment, see our arbitrage framework and our guide to detecting microsecond latency arbitrage.
How do you measure the reliability and variability of consensus odds?
A consensus is a point estimate, and a point estimate without a spread is half an answer. Measure how much the books agree and how stable the number is across time.
Cross-sectional dispersion: compute the standard deviation, or the interquartile range, of no-vig probabilities across books at each snapshot. Tight dispersion means a confident consensus. Wide dispersion means the books are pricing different information.
Temporal volatility: track the rolling standard deviation of the consensus over fixed windows. A consensus that jumps between snapshots is less reliable than one that drifts.
Outlier detection: flag any book more than a chosen number of median absolute deviations from the median, then test whether excluding it changes the result.
Autocorrelation: since line changes can be negatively autocorrelated, as the Management Science research above documents, check whether recent moves tend to reverse in your sample before treating momentum as a given.
Calibration: bucket historical consensus probabilities and compare each bucket to realized outcome frequency. A well-calibrated consensus priced at 0.60 should win about 60% of the time.
Bootstrap intervals: resample the book set to produce a confidence band around the consensus, which shows how sensitive the number is to which books you included.
Report the interval alongside the point estimate, and log the book count, because a consensus built from fewer books may deserve less trust than one built from a broader book sample.
How do Smart Money and trader skill scores adjust consensus odds?
A plain consensus treats every participant equally. Smart Money tracking and trader skill scores let you relax that assumption, giving more weight to traders with a demonstrated record.
The basic technique is skill-weighted pooling. Instead of averaging prices, build a second probability from the positions of high-skill wallets, then blend it with the unweighted consensus. The blend weight is a parameter you fit on history, not a constant you assume. If the skilled-wallet signal adds no out-of-sample accuracy, its weight should fall toward zero.
Several guardrails keep this honest. Score traders on a window that does not overlap the period you are predicting, or the weights leak future information. Shrink scores for wallets with few resolved trades, since a short winning streak is weak evidence of skill. Separate directional conviction from hedging activity, because a large position can be one leg of a hedge rather than a view.
Then treat the divergence between skill-weighted and raw consensus as its own feature. When skilled wallets lean one way against the crowd, that gap is what you test for predictive value. Our trader cohort analysis and signal generation guide show how cohorts are built and evaluated.
What should a developer and trader checklist include?
Here is my working view. The workflow is short enough to memorize: compute a no-vig consensus, compare it to your fair model, and watch for moves greater than 10%. Where most pipelines fail is not the math but the paper trail. Document the book list, the timestamps and the pipeline code, so any number can be regenerated on demand. And prefer normalized cross-venue snapshots over hand-stitched feeds, because a signal that survives across venues is far harder to fool yourself with than one found on a single book.
— Dean
How we help you implement consensus snapshots

Our Data API gives you normalized cross-venue snapshots without the stitching work, and the Data API page shows how it fits a consensus pipeline.
Normalized data across Polymarket, Kalshi and Limitless
Historical data for reproducible tests
Current pricing details are on our Data API page. Start with our data feed guide, then import snapshot data for your first consensus backtest.
FAQ
What are consensus odds in sports betting?
Consensus odds are a pooled estimate of an outcome’s probability, built from the prices of multiple bookmakers at one timestamp. They are usually normalized to remove each book’s margin before pooling, so the result reflects the market’s view rather than its fees.
How do you calculate consensus odds step by step?
Convert each book’s odds to implied probability, divide by that market’s overround to remove the vig, then average the results or pool them in log-odds. Convert the pooled figure back to odds if you need a price rather than a probability.
Should I use the average or the median for consensus odds?
Use the median when books disagree or one quote looks stale, since it resists outliers. Use the average when quotes are tightly clustered. Log-odds pooling is the better choice when probabilities sit near the extremes, because it avoids underconfidence.
What is the difference between consensus odds and public betting percentages?
Consensus odds measure prices across books, while public percentages measure the share of tickets or money on each side. They can diverge because tickets count bets and handle counts dollars, and a gap between them is often more informative than either alone.
Do prediction market prices need vig removal?
A binary prediction market contract price can be read directly as an implied probability, though fees and market structure may affect the price. Still confirm that the two sides sum close to 1.0 and check book depth before treating the price as reliable.
Sources
Consensus Odds Calculation for Developers: No Vig, API Snapshots
Consensus odds calculation pools bookmaker prices at one timestamp into a single probability estimate. Before you bet, strip the vig from every book, pool the normalized probabilities, and compare the result to your own fair probability or to public betting percentages. Large divergences and sharp line moves carry the strongest signal.
TL;DR:
Use the median when quotes conflict; inspect extreme prices if arithmetic and log odds estimates differ by more than a point or two.
Ticket share counts bets, while handle share counts dollars; trust handle more in liquid markets, but favor bookmaker consensus when markets are small and illiquid.
Home outcomes whose odds fell more than 10% outperformed those whose odds rose by 13.83 percentage points, but movement may reflect bookmaker risk management.
Treat binary prediction market prices as probabilities without removing a bookmaker margin, but verify prices sum near 1.0 and inspect spread, depth, and trade recency.
For cross venue pooling, match canonical event IDs and settlement conditions, align timestamps, and store each venue’s contribution so the result can be audited.
Assymetrixdata.assymetrix.comBuild Cross-Venue Consensus With Unified DataAssymetrix brings prediction market data from Polymarket, Kalshi, and Limitless into one API for consensus snapshots and analysis.Explore the Data API
Table of Contents
How do you convert odds to implied probability and remove the vig?
Which methods compute consensus odds best?
What does a worked consensus calculation look like?
How does consensus differ from public betting percentages?
How do consensus trends and line movement create value?
How do you build a consensus pipeline with APIs and snapshots?
How should you read consensus odds in prediction markets versus sportsbooks?
How do you integrate cross-venue prediction market data into a consensus?
How do you find arbitrage using consensus odds in prediction markets?
How do you measure the reliability and variability of consensus odds?
How do Smart Money and trader skill scores adjust consensus odds?
What should a developer and trader checklist include?
How we help you implement consensus snapshots
Sources
How do you convert odds to implied probability and remove the vig?
Every consensus method starts from implied probability, so get these conversions right first.
Decimal odds: implied probability = 1 / decimal odds.
American odds, positive (+150): decimal = 1 + (odds / 100).
American odds, negative (-150): decimal = 1 + (100 / |odds|).
Overround: the sum of 1/odds across all outcomes in a market. Anything above 1.0 is bookmaker margin.
No-vig probability: each outcome’s inverse odds divided by the overround.
For a two-way market, convert each price to decimal odds, calculate the raw implied probabilities, and divide each by their sum to remove the overround. The resulting no-vig probabilities sum to 1.0.
Skip this step and every pooled number is inflated by margin, so the consensus runs systematically off the true price. Sportsbook commission also matters for edge sizing: a statistical theory of sports betting shows that estimating quantiles near the median is central to wagering decisions, and that small deviations of 1–3 points can permit positive expected profit under realistic commission assumptions.
Which methods compute consensus odds best?
Five approaches cover most practical needs. Pick by how much your book sample disagrees and how much reliability data you hold.
Arithmetic average: the mean of no-vig probabilities. Simple, but a single stale or mispriced book drags it.
Median: robust when books disagree, and often the safer default for thin markets.
No-vig (fair) pooling: normalize every book first, then pool. This is a precondition for the other methods, not an alternative to them.
Weighted pooling: weight books by liquidity, recency of quote, or verified reliability. Treat the weights as hypotheses you test, not facts.
Log-odds pooling: convert each probability to z = ln(p/(1-p)), average z, then convert back. Because probabilities are non-linear, pooling on log-odds (the geometric mean of odds ratios) avoids underconfidence and handles extreme probabilities better than a straight average.
Pro Tip: Compute both the arithmetic and log-odds consensus on every market. When they diverge by more than a point or two, a quote at the extremes is usually driving it, and that is the book to inspect.
What does a worked consensus calculation look like?
Illustrative inputs: three books quote the same two-way moneyline at one timestamp. Book A has -150 / +130, Book B has -140 / +120, Book C has -160 / +140.
Convert the favorite side to implied probability: Each book’s favorite-side implied probability is calculated from its quoted odds.
Convert the underdog side: Calculate each book’s underdog-side implied probability and overround from its quoted odds.
Normalize the favorite: Normalize each book’s favorite-side probability by its overround.
Calculate the arithmetic consensus from the normalized probabilities. For the log-odds consensus, transform each probability to log-odds, average those values, then convert the result back to a probability.
The two methods agree here because the quotes are tightly clustered. They separate when one book sits far from the rest, which is exactly when you want the log-odds figure. If your model and the consensus differ, compare the market price with your estimate before acting. Check the best available price, the liquidity behind it, and how close the snapshot is to the event.
How does consensus differ from public betting percentages?
Consensus odds describe prices. Public percentages describe who is betting. They answer different questions, so use both.
Ticket percentage: the share of individual bets on a side. It tracks how many people like an outcome.
Handle percentage: the share of money wagered. It tracks conviction weighted by bet size.
Why they diverge: multiple accounts inflate tickets, a few large bets dominate handle, time windows differ, and each source samples a different set of books.
Which to trust: in small, illiquid markets a handful of bets can swing either number, so lean on consensus. In liquid markets, handle is the more informative figure.
When divergence is actionable: consensus moves one way while handle runs the other, and the gap persists across snapshots.
Before using any percentage, confirm the contributing book list, the time window, and whether the figure is tickets or handle. A mislabeled metric produces confident wrong conclusions.
How do consensus trends and line movement create value?
Line movement is evidence, not noise. A study of 17,380 football games from 2015 to 2025 found that home outcomes whose odds fell by more than 10% outperformed those whose odds rose by 13.83 percentage points. The same research frames line movement as often reflecting bookmaker risk management rather than absolute truth.
Separate work on real-time betting line movement in Management Science found that forecasts do not always improve closer to game time and that changes are negatively autocorrelated, which sophisticated bettors can exploit. Visibility matters too: lower-visibility NFL games show larger and more frequent line movements because oddsmakers allocate fewer analytical resources.
Read opening versus current: the remaining price after the public has moved the line is what you can actually trade.
Set a threshold: treat moves of 10% or more as a signal worth testing in your own data.
Respect tradability: limits, liquidity and slippage can erase a theoretical edge.
Run a fixed flow: detect the move, compare consensus to fair odds, secure the best price, then size the bet with risk controls.
How do you build a consensus pipeline with APIs and snapshots?
Reproducibility is the whole job. A consensus number you cannot regenerate is a number you cannot audit.
Inputs: canonical event IDs, per-book odds, outcome identifiers and timestamps. Without canonical IDs, joins across venues silently break.
Snapshots: keep an opening snapshot, fixed-interval snapshots and event-triggered snapshots, and retain enough history to roll back and audit.
Fields: odds API documentation describes summary objects with fairOdds, bestOdds and avgOdds, plus snapshot rows carrying avgImpliedProb, fairOdds, bestPrice, bookCount and snapshotAt. These map directly to the normalization and pooling steps above.
Backfill: when a snapshot is missing, carry the last known value forward with a staleness flag rather than interpolating, and align venue timestamps to one clock.
Latency: algorithmic strategies need streaming. Our WebSocket API guide covers live feeds, and our notes on canonical IDs and low-latency pipelines show how a normalized feed removes per-league special-casing.
Pro Tip: Store the book list and snapshot timestamp alongside every consensus value. Six months later, that metadata is the only way to explain why a number changed.
How should you read consensus odds in prediction markets versus sportsbooks?
A sportsbook price embeds margin. A prediction market price is a traded contract, and a contract priced at 0.58 is read directly as a 58% probability, with no overround to strip in a binary market. That makes prediction market prices cleaner inputs to a consensus, but not automatically better ones.
The structural differences matter. Sportsbooks set prices as monopolistic bookmakers, and research cited in the Claremont thesis traces the favorite–longshot bias to markdowns set by price elasticity, which creates different implied margins across favorites and longshots. Prediction markets are order-book driven, so the spread, depth and last-trade recency determine how much a quoted price means. A thin book with a stale last trade is a weak signal even though it carries no vig.
Practical rules follow. Treat prediction market midpoints as already-normalized probabilities, but check that the two sides of a binary market sum close to 1.0 before trusting them. Weight by depth, not just by price. And label the source of every probability in your pool, because a consensus that silently mixes sportsbook no-vig figures with exchange midpoints is hard to interpret and impossible to debug.
When sportsbook consensus and prediction market price disagree, that gap is the object of study. It can reflect different participant pools, different settlement rules, or simple lag, and your pipeline should record which.
How do you integrate cross-venue prediction market data into a consensus?
Cross-venue data adds independent observations, and independent observations are what make a consensus more accurate. Polymarket, Kalshi and Limitless each attract different participants, so a pooled price across them dilutes the idiosyncrasies of any single venue.
Start with entity resolution. The same real-world event has a different identifier on every venue, and a consensus is only as good as the matching. Canonical IDs solve this once, upstream, instead of in every strategy. Our guide to shipping sports pipelines with canonical IDs walks through the approach.
Next, normalize semantics. Confirm that contracts resolve on the same condition, since a market that settles on regulation time and one that includes overtime are different questions. Convert every venue’s price to a probability on the same side of the outcome, then align timestamps to a shared clock before pooling.
Then pool with log-odds, weighting by depth and recency. A venue with a deep book and a fresh quote earns more weight than one with a wide spread and an old print. Record the per-venue contribution so you can see which venue moved the consensus.
Finally, validate against history. Our historical data guide for reproducible backtests covers how to test whether adding a venue improved calibration, which is the only honest measure of whether the integration paid off.
How do you find arbitrage using consensus odds in prediction markets?
Consensus gives you a reference price. An arbitrage candidate is a venue quoting meaningfully away from that reference, or a set of contracts whose prices imply probabilities that cannot all be true at once.
Two checks do most of the work. First, compare each venue’s price to the cross-venue consensus. A venue priced well below consensus on one side while another prices the opposite side cheaply may allow a hedge. Second, test internal consistency: in a binary market, the YES and NO prices should cost less than 1.0 combined only when an opportunity exists, and in a multi-outcome market the sum of prices across all outcomes should be checked against 1.0.
A flagged gap is a hypothesis, not a trade. Fees, settlement-rule differences, withdrawal friction and execution risk can consume the apparent edge, and the second leg of a hedge may reprice before you fill it. Depth matters as much as price: a gap that exists only for ten contracts is not scalable.
Timing is the other constraint. Gaps can close quickly, so detection may need to run on streaming data rather than periodic polling. For deeper treatment, see our arbitrage framework and our guide to detecting microsecond latency arbitrage.
How do you measure the reliability and variability of consensus odds?
A consensus is a point estimate, and a point estimate without a spread is half an answer. Measure how much the books agree and how stable the number is across time.
Cross-sectional dispersion: compute the standard deviation, or the interquartile range, of no-vig probabilities across books at each snapshot. Tight dispersion means a confident consensus. Wide dispersion means the books are pricing different information.
Temporal volatility: track the rolling standard deviation of the consensus over fixed windows. A consensus that jumps between snapshots is less reliable than one that drifts.
Outlier detection: flag any book more than a chosen number of median absolute deviations from the median, then test whether excluding it changes the result.
Autocorrelation: since line changes can be negatively autocorrelated, as the Management Science research above documents, check whether recent moves tend to reverse in your sample before treating momentum as a given.
Calibration: bucket historical consensus probabilities and compare each bucket to realized outcome frequency. A well-calibrated consensus priced at 0.60 should win about 60% of the time.
Bootstrap intervals: resample the book set to produce a confidence band around the consensus, which shows how sensitive the number is to which books you included.
Report the interval alongside the point estimate, and log the book count, because a consensus built from fewer books may deserve less trust than one built from a broader book sample.
How do Smart Money and trader skill scores adjust consensus odds?
A plain consensus treats every participant equally. Smart Money tracking and trader skill scores let you relax that assumption, giving more weight to traders with a demonstrated record.
The basic technique is skill-weighted pooling. Instead of averaging prices, build a second probability from the positions of high-skill wallets, then blend it with the unweighted consensus. The blend weight is a parameter you fit on history, not a constant you assume. If the skilled-wallet signal adds no out-of-sample accuracy, its weight should fall toward zero.
Several guardrails keep this honest. Score traders on a window that does not overlap the period you are predicting, or the weights leak future information. Shrink scores for wallets with few resolved trades, since a short winning streak is weak evidence of skill. Separate directional conviction from hedging activity, because a large position can be one leg of a hedge rather than a view.
Then treat the divergence between skill-weighted and raw consensus as its own feature. When skilled wallets lean one way against the crowd, that gap is what you test for predictive value. Our trader cohort analysis and signal generation guide show how cohorts are built and evaluated.
What should a developer and trader checklist include?
Here is my working view. The workflow is short enough to memorize: compute a no-vig consensus, compare it to your fair model, and watch for moves greater than 10%. Where most pipelines fail is not the math but the paper trail. Document the book list, the timestamps and the pipeline code, so any number can be regenerated on demand. And prefer normalized cross-venue snapshots over hand-stitched feeds, because a signal that survives across venues is far harder to fool yourself with than one found on a single book.
— Dean
How we help you implement consensus snapshots
Our Data API gives you normalized cross-venue snapshots without the stitching work, and the Data API page shows how it fits a consensus pipeline.
Normalized data across Polymarket, Kalshi and Limitless
Historical data for reproducible tests
Current pricing details are on our Data API page. Start with our data feed guide, then import snapshot data for your first consensus backtest.
FAQ
What are consensus odds in sports betting?
Consensus odds are a pooled estimate of an outcome’s probability, built from the prices of multiple bookmakers at one timestamp. They are usually normalized to remove each book’s margin before pooling, so the result reflects the market’s view rather than its fees.
How do you calculate consensus odds step by step?
Convert each book’s odds to implied probability, divide by that market’s overround to remove the vig, then average the results or pool them in log-odds. Convert the pooled figure back to odds if you need a price rather than a probability.
Should I use the average or the median for consensus odds?
Use the median when books disagree or one quote looks stale, since it resists outliers. Use the average when quotes are tightly clustered. Log-odds pooling is the better choice when probabilities sit near the extremes, because it avoids underconfidence.
What is the difference between consensus odds and public betting percentages?
Consensus odds measure prices across books, while public percentages measure the share of tickets or money on each side. They can diverge because tickets count bets and handle counts dollars, and a gap between them is often more informative than either alone.
Do prediction market prices need vig removal?
A binary prediction market contract price can be read directly as an implied probability, though fees and market structure may affect the price. Still confirm that the two sides sum close to 1.0 and check book depth before treating the price as reliable.
Sources
Other Blog


