
Article
Field notes from building the deepest prediction market data infrastructure in the industry. What happens when you index nearly a billion rows of on-chain and off-chain data going back to September 2020 — and what the data reveals that no single platform can see.

For ten blog posts, we've written about a gap.
The intelligence layer that prediction markets are missing. The synthesis that doesn't exist. The cross-venue signal nobody is reading. The five structural factors that make price ≠ probability.
This post is different. This is how we started filling the gap.
Over the past several months, Assymetrix has been indexing prediction market data — on-chain blockchain events and off-chain market metadata — across platforms, going back to September 2020. We've captured token transfers, matched orders, order fills, position splits, merges, payout redemptions, condition resolutions, market metadata, price snapshots, and outcomes. All of it decoded, enriched, and structured specifically for prediction markets.
The result: nearly a billion rows. Over half a terabyte. Both CTF exchange contracts indexed — Standard and NegRisk — which most researchers and competitors don't even realize are separate systems. A canonical normalization layer that maps different platforms' data into a single unified schema.
We're not the first to attempt prediction market data aggregation. Several tools exist — trading-focused dashboards, raw blockchain APIs, open-source SDKs. But the process of building this infrastructure revealed things about prediction market data that changed how we think about the entire problem.
Here are five findings.
Finding #1: The "Same Event" Almost Never Is
The first thing you discover when you try to match markets across platforms is that identical-looking events are often structurally different contracts.
A market titled "US Recession in 2026?" on one platform resolves based on two consecutive quarters of negative GDP growth — the textbook definition. The "same" market on another platform may use the official NBER designation, a different timing window, or a different resolution source entirely.
We built matching algorithms that go beyond title similarity. They compare resolution criteria, source authorities, timing windows, and outcome definitions. What we found: a significant portion of markets that appear identical across platforms have at least one material difference in their resolution rules.
This connects directly to what we wrote in Blog #10 about resolution rules being one of the five structural filters between price and probability. The Cardi B Super Bowl market — $57 million wagered, opposite answers on two platforms — wasn't an anomaly. It was a symptom of a structural problem that exists across the entire cross-venue data landscape.
Our schema captures resolution metadata at the contract level — source authority, resolution timing, carveout rules, dispute mechanisms — so that when you compare prices across venues, you're comparing like with like.
Finding #2: Liquidity Quality Varies More Than Liquidity Quantity
Most data tools report volume and open interest. Those are useful but incomplete.
What we found when we indexed order-level depth across platforms is that the same dollar volume can represent very different market quality. A market with $500K in volume but a wide bid-ask spread is a fundamentally different trading environment than one with $500K and a tight spread. The first is illiquid despite the headline number. The second is genuinely tradeable.
We built a liquidity quality framework that incorporates bid-ask spread, depth at multiple levels, volume concentration — is the volume from a handful of large wallets or hundreds of independent traders? — and time-weighted activity.
The results confirmed something we suspected from the accuracy research: the 84% vs 61% accuracy gap that Fensory documented isn't just about volume thresholds. It's about market microstructure. Two markets with the same dollar volume can have completely different signal quality depending on how that volume is distributed.
Finding #3: On-Chain Data Is the Deepest Moat — and Almost Nobody Has It
This was the most consequential finding.
Prediction market platforms expose APIs for market metadata and current prices. But the richest data in prediction markets lives on-chain — and it's far deeper than what any platform's API provides.
On-chain, we can see every token transfer, every matched order, every fill, every position split and merge, every payout redemption, and every condition resolution. We can reconstruct the complete trading history of any wallet. We can calculate P&L across an entire portfolio. We can identify which addresses are consistently profitable and which are consistently wrong. We can see the flow of capital through the system at a resolution that off-chain APIs simply don't provide.
We indexed both CTF exchange contracts — Standard and NegRisk. This matters because a large portion of Polymarket's more recent volume runs through the NegRisk contract, and most external data tools only index Standard. If you're only looking at half the on-chain infrastructure, you're missing a significant share of the actual trading activity.
When we surveyed the competitive landscape, we found that virtually no independent data provider offers structured, prediction-market-specific on-chain data at this depth. Raw blockchain APIs exist, but they require buyers to do their own decoding, normalization, and enrichment. Our data is prediction-market-native: decoded, enriched with market metadata, and structured for the queries that traders, researchers, and builders actually run.
Finding #4: The Dome Acquisition Changed the Competitive Landscape
In February 2026, Polymarket acquired Dome — a YC-backed startup (Fall 2025 cohort, $5.2 million raised) that had built the most credible independent unified API for prediction markets. Dome had 50+ developers building on it. The founding team were ex-Alchemy engineers who had personally helped Polymarket scale during the 2024 election.
The acquisition was covered by The Block, Bankless, CoinDesk, and dozens of crypto media outlets. It was Polymarket's first acquisition specifically targeting developer infrastructure.
Here's what that acquisition means for the data landscape:
The best-funded independent cross-platform data layer now lives inside one platform's ecosystem. A Polymarket-owned API will always prioritize Polymarket's liquidity, Polymarket's markets, Polymarket's developer ecosystem. The structural adjustments we described in Blog #10 — accounting for trader composition bias, resolution rule differences, liquidity quality variance between venues — require a neutral position. You can't objectively compare Platform A and Platform B when Platform A owns your data layer.
The 50+ developers who were building on Dome are now searching for an independent replacement. Some smaller tools are trying to fill the gap — early-stage aggregators, open-source SDKs, trading-focused dashboards. None of them offer on-chain depth. None of them have historical coverage going back to 2020. None of them provide the structural intelligence layer on top of the aggregation.
This is the vacuum Assymetrix was built to fill. And it's a vacuum that exists specifically because the market validated the thesis — cross-platform data infrastructure is so valuable that the largest exchange spent millions to acquire it and bring it in-house.
Finding #5: Price Snapshots at Scale Reveal What Daily Data Hides
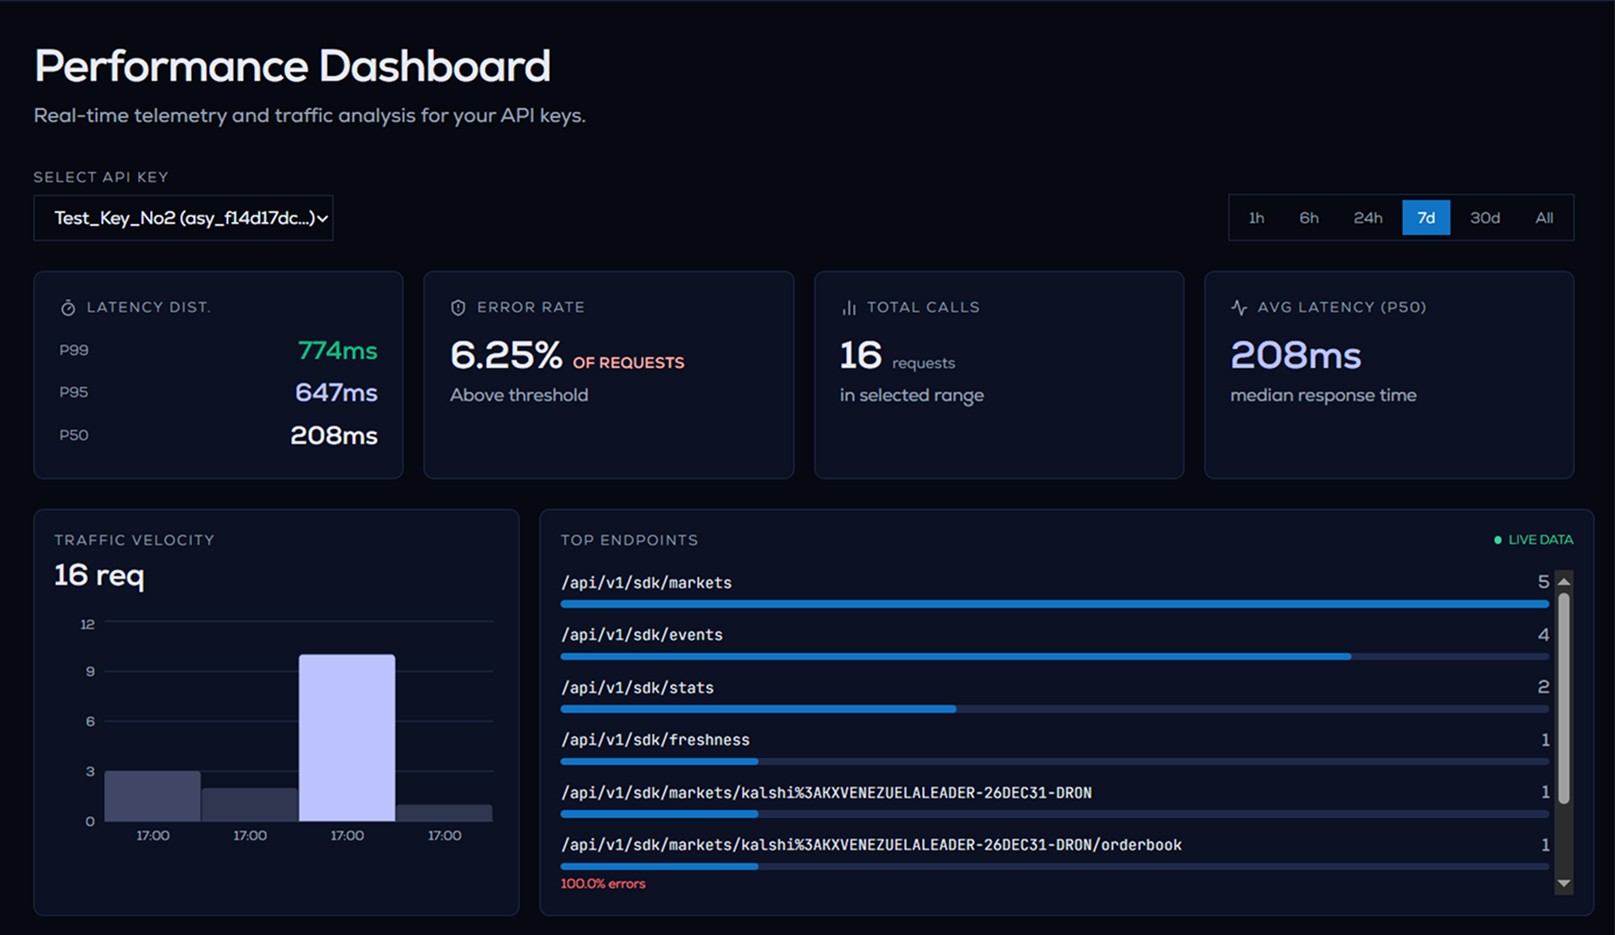
We capture price snapshots at 15-minute intervals across all indexed markets — tens of millions of snapshots creating a continuous probability surface over time.
Why this matters: most available prediction market data is daily or hourly at best. But prediction markets move in minutes, especially during breaking news events. The Iran crisis. The Super Bowl. Fed announcements. Election nights. The signal lives in the intraday movement — how fast prices react, how quickly different platforms converge, where temporary divergence creates arbitrage windows.
At 15-minute granularity, we can see things that daily snapshots completely miss: the speed of price discovery after a news event, the lag between platforms processing the same information, and the microstructure of how cross-venue convergence actually works in practice.
For backtesting, this granularity is the difference between "what did the market think on that day?" and "how did the market process that event in real time?" The first is useful for research. The second is useful for trading.
What It Looks Like in Practice
Here's what building on Assymetrix data feels like. These examples show the kind of queries and workflows the API enables — the intelligence layer applied through code.
Cross-Venue Divergence Detection
Most data tools show you one platform's price. Assymetrix shows you where platforms disagree — and why it matters.
Notice the resolution_compatible flag. That's the difference between aggregation and intelligence. When two platforms show different prices, the first question is whether they're even answering the same question. Our schema checks this for you.
On-Chain Wallet Intelligence
Off-chain APIs show you current prices. On-chain data shows you who's behind them.
This query reconstructs wallet P&L from on-chain token transfers, order fills, and payout redemptions — nearly a billion rows of data distilled into one leaderboard call. No other independent data provider can run this query. The on-chain data required to reconstruct wallet-level P&L doesn't exist in any off-chain API.
Historical Price Surface — 15-Minute Candles
Daily snapshots tell you what happened. Our 15-minute candles tell you how it happened.
The market dropped 4 points in 15 minutes as the deadline passed, then stabilized. Daily data would show this as "48% on April 6." Our data shows the velocity of price discovery — how fast the market processed the information, the volume signature of the move, and whether the reaction was sustained or mean-reverted.
For backtesting, this granularity is the difference between "what did the market think?" and "how did the market think?"
Liquidity Quality Scoring
Volume tells you how much was traded. Liquidity quality tells you whether you should trust the price.
Both platforms have strong volume. But Kalshi has tighter spreads, more unique traders, and less concentration in top wallets — giving it a higher quality score on this particular market. The raw volume would suggest Polymarket is the "bigger" market. The quality score tells you Kalshi's price is the more reliable signal here.
This is the structural adjustment from Blog #10 made queryable through code.
The Data Underneath
What powers these queries:
Data Layer | What It Contains | Records | Coverage |
|---|---|---|---|
On-chain events | Token transfers, matched orders, order fills, position splits/merges, payout redemptions, and condition resolutions (Polymarket + Limitless SQD) | ~1.94 billion rows | Sep 2020 → present |
Off-chain metadata | Markets, events, outcomes, trades, user positions, and real-time data across Polymarket, Kalshi, and Limitless | ~274M rows | Complete multi platform catalog |
Price snapshots | Time-series probability data captured at regular intervals across markets | ~207 million snapshots | Mar 2026 → continuous |
Canonical layer | Unified schema mapping markets, events, outcomes, trades, and orderbooks across platforms | ~30.5M rows | Active and growing |
Total indexed: Nearly a billion rows. Over half a terabyte. Both CTF exchange contracts (Standard + NegRisk). The deepest independent prediction market dataset available.
What Existing Tools Offer vs. What Assymetrix Adds
Capability | Trading Dashboards | Raw Blockchain APIs | Open-Source SDKs | Platform-Owned Tools | Assymetrix |
|---|---|---|---|---|---|
Current market prices | ✅ | ✅ | ✅ | ✅ | ✅ |
Cross-venue comparison | ✅ | ❌ | ⚠️ limited | ⚠️ biased | ✅ with resolution matching |
OHLCV candle history | ❌ | ❌ | ❌ | ⚠️ limited | ✅ 15m/1h/4h/1d |
On-chain order fills | ❌ | ⚠️ raw, unstructured | ❌ | ❌ | ✅ decoded + enriched |
Token transfer history | ❌ | ⚠️ raw | ❌ | ❌ | ✅ 389M+ records |
Wallet P&L reconstruction | ❌ | ❌ | ❌ | ❌ | ✅ |
15-min price snapshots | ❌ | ❌ | ❌ | ❌ | ✅ 66M+ records |
Historical depth (pre-2023) | ❌ | ⚠️ | ❌ | ❌ | ✅ Sep 2020 |
Resolution metadata comparison | ❌ | ❌ | ❌ | ❌ | ✅ |
Liquidity quality scoring | ❌ | ❌ | ❌ | ❌ | ✅ |
Venue-neutral independence | ⚠️ | ✅ | ✅ | ❌ | ✅ |
Read the right column. Every row where Assymetrix shows ✅ and the other columns don't — that's our moat.
What We're Launching
Assymetrix is opening early access to this data infrastructure. Here's what the offering includes:
REST API — Normalized market data including metadata, real-time prices, historical time series, resolution metadata, and liquidity quality indicators. Covering Polymarket at launch with additional venues being integrated.
WebSocket Feeds — Real-time price updates streamed across all indexed markets. Concurrent connection limits scale by tier.
OHLCV Candle Data — Open-high-low-close-volume candles at multiple resolutions (15-minute, hourly, 4-hour, daily) built from our price snapshot archive. Purpose-built for backtesting and quantitative research.
On-Chain Data Access — Structured, decoded, enriched on-chain events including order fills, token transfers, position splits/merges, and payout redemptions. Historical coverage back to September 2020. Both CTF contracts are indexed.
Canonical Normalized Schema — A unified data layer that maps different platforms' market structures into a single queryable schema. Markets, events, and outcomes normalized across venues.
Bulk Export — Parquet and CSV delivery for teams that need to run analysis on their own infrastructure.
MCP Server (coming) — The full dataset accessible to AI models via Model Context Protocol. Build agents that query cross-venue prediction market data in natural language.
Python and TypeScript SDKs (coming) — Drop-in libraries for the most common development environments.
The Tier Structure
We're launching with a tiered access model designed around one principle: current prices are free, depth is the differentiator.
Every competitor gives away real-time market data. So do we. The moment a developer needs historical order fills, wallet-level analytics, full on-chain event data, or 15-minute price snapshots for backtesting — that's where Assymetrix becomes the only option.
Tier | Price | Best For | What You Get |
|---|---|---|---|
Free | $0 | Prototyping,testing | Basic market access, 1 API key, 60 rpm |
Developer | $49/mo | builders, early-stage integrations | Markets + trades access, 1 API key, 100 rpm |
Pro | $199/mo | serious apps, trading tools, production integrations | Markets + trades + orderbook, up to 5 keys, 350 rpm |
Business | $499/mo | growing teams and startups scaling products | Full SDK access, 25 keys, 1000 rpm, admin keys (coming soon) |
Enterprise | $2,000+/mo | large orgs, high-scale infrastructure | Unlimited keys, unlimited rate limits, full SDK + admin access |
Academic | $200/yr | students, research use cases | Markets + trades access, 2 keys, 100 rpm |
Accessing the data
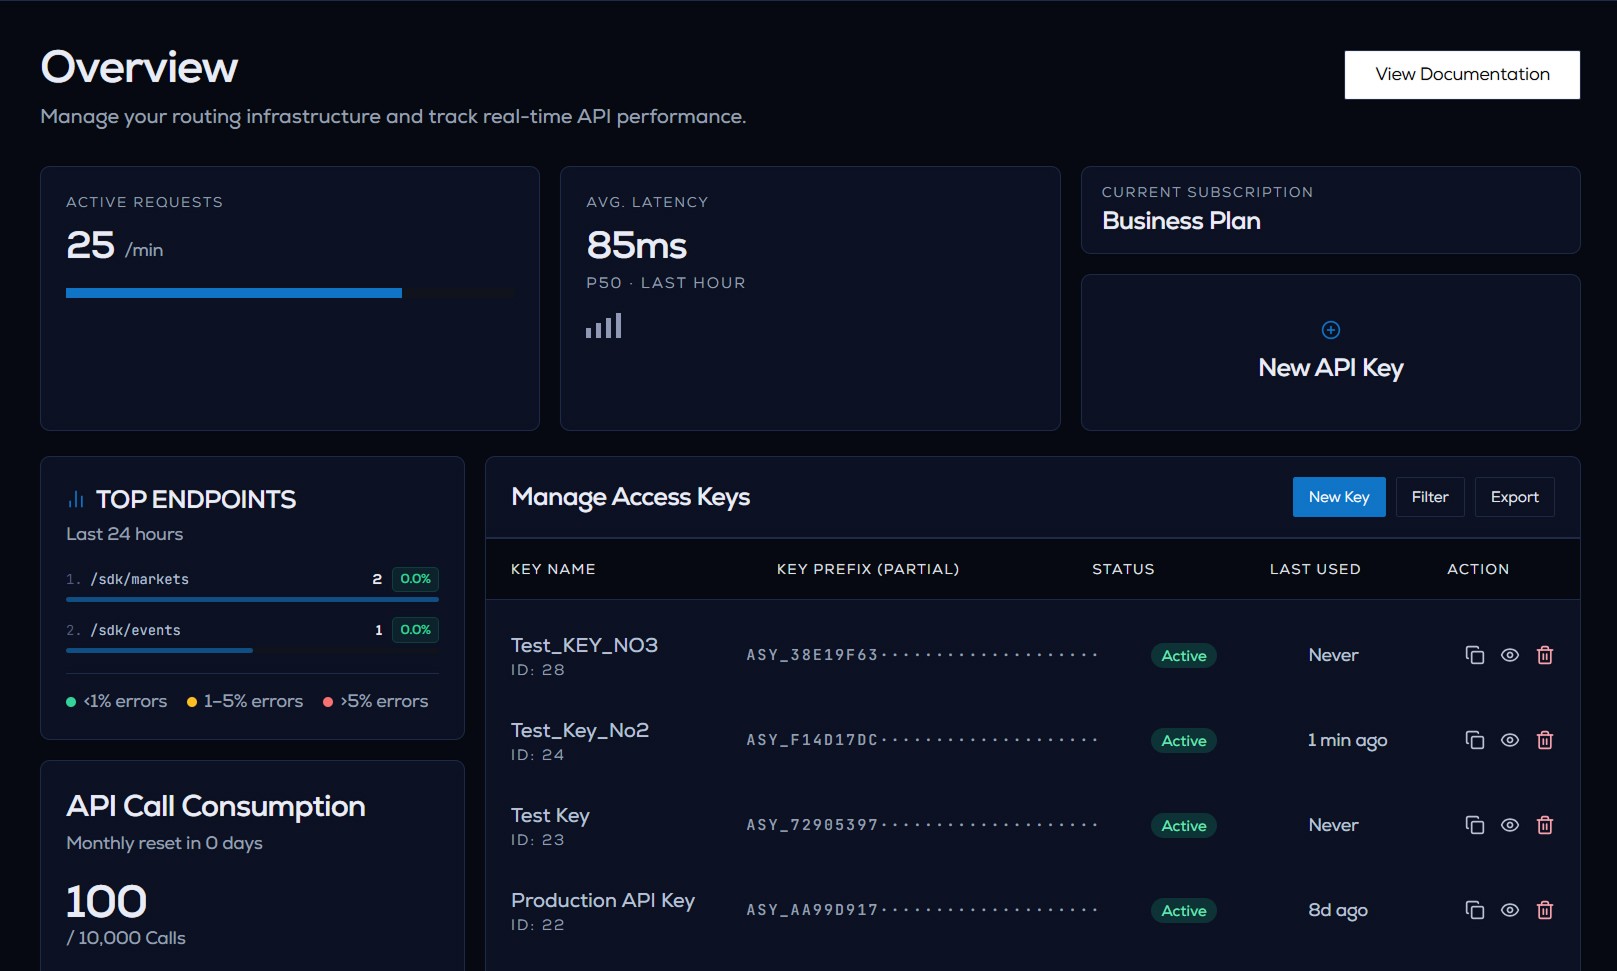
We expose all of this through our Vendor SDK, a read only API designed to make prediction market data easy to consume. Alongside Polymarket, Kalshi, and Limitless, we also provide access to our own internal continuously expanding dataset, giving consumers effectively limitless data in a single unified format. Everything is normalized so you don’t have to deal with platform specific differences, and access is managed through API keys with tier based permissions controlling what data can be queried.
The API is built to be straightforward to integrate. You can filter and search markets, resolve them using multiple identifier formats, and pull everything from real time snapshots to historical trades and pricing data. We also provide a built-in playground in the dev portal so you can explore endpoints and test requests directly with your API key before wiring it into your own systems.
Who This Is For
Quantitative traders and trading firms — On-chain order flow data that doesn't exist anywhere else. Wallet-level P&L reconstruction. 15-minute candles for backtesting. The deepest historical archive in the prediction market data space.
AI agent builders — MCP server access (coming soon) to the richest prediction market dataset available. Build agents that can query on-chain trading history, cross-venue price comparisons, and structural metadata in natural language.
Institutional research teams — Prediction market data as alternative data for macro research. Historical probability surfaces for event-driven analysis. Structured on-chain data for market microstructure research.
Media and analytics platforms — Normalized, structurally-aware market data for editorial coverage. Resolution metadata that prevents the Cardi B problem. Liquidity quality indicators that tell you which numbers to trust.
Developers building prediction market tools — The infrastructure layer that saves months of integration work and adds depth no other provider offers. Free tier to build, paid tiers to scale.
Why Independence Matters
Assymetrix's data offering is venue-neutral by design. We index every platform with the same depth, the same normalization rigor, and the same structural assessment. No single exchange partnership compromises our data objectivity.
When Polymarket acquired Dome, they made a rational business decision — owning the data layer gives them developer lock-in. But it created a structural conflict of interest for anyone who needs objective cross-venue data. A Polymarket-owned data tool will never tell you that Kalshi has better liquidity on a specific market, or that Polymarket's resolution rules introduced more risk on a particular contract.
The intelligence layer only works if the data layer is neutral. That's our commitment: wherever the data leads, that's what you see — regardless of which platform it favors.
The Data Layer Is Just the Beginning
Ten blog posts built the thesis. This post is the first product.
The APIs, on-chain data, price snapshot archive, and canonical schema are the infrastructure that everything else gets built on. The platform — with cross-venue dashboards, whale tracking, arbitrage detection, AI-powered signals, and the structural-adjustment engine we described in Blog #10 — is coming next. Built on this data layer.
But the data layer stands on its own. For builders, traders, and researchers who need the deepest prediction market data available — with the independence to trust it across venues — early access starts now.
This is the eleventh installment in the Assymetrix Intelligence Brief series — and the first Builder Brief.
Previous: "A Soldier Used Classified Intelligence to Make $400K on Polymarket. The Data Saw It First."
Assymetrix is building the intelligence and synthesis layer for prediction markets. The data infrastructure is live. Early access is open.
Other Blog


