
Article
CNN displays "65%." Traders assume it means a 65% chance. It doesn't. Here's what a prediction market price actually represents — and the five structural factors that make it something more complex, more useful, and more misleading than a simple probability.

There's a number on your screen right now. Maybe it's on CNN, sourced from Kalshi. Maybe it's on the Wall Street Journal, sourced from Polymarket. Maybe it's on Yahoo Finance's new prediction markets hub. It says something like "65%" next to an event — the probability of a Fed rate hold, a ceasefire, a candidate winning.
You look at that number and think: there's a 65% chance this happens.
You're wrong. Not because the number is fake. But because a prediction market price and a probability are not the same thing — and the gap between them is where most of the value (and most of the risk) in prediction market data actually lives.
This matters because $65 billion has flowed through prediction markets in 2026 so far. $6.5 billion in a single week. CNN, Dow Jones, Yahoo Finance, and ESPN are publishing these numbers to mainstream audiences every day. 36% of American voters are consuming this data. And almost everyone — media partners, casual users, even many active traders — is making the same fundamental error: treating the price as if it were a probability.
It's not. Here's why.
What a Price Actually Represents
A prediction market price is the equilibrium point between buyers and sellers in a specific market, on a specific platform, at a specific moment. It reflects the marginal trader's willingness to pay — the point at which no more buyers want to buy at a higher price and no more sellers want to sell at a lower price.
In a perfectly efficient market with infinite liquidity, zero fees, no structural constraints, and a representative sample of all informed participants, this price would equal the true probability. Economists have proven this theoretically — Wharton's research on interpreting prediction market prices as probabilities confirms that under idealized conditions, prices and mean beliefs converge.
But we don't live in idealized conditions. We live in a world where Kalshi and Polymarket show different prices for the same event, where $10,000 markets produce wildly different signals than $10 million markets, where anonymous offshore traders and KYC-verified US traders bring different information sets, and where the rules governing how an event resolves vary from platform to platform.
The gap between the price you see and the probability it approximates is created by five structural factors. Understanding them turns you from a passive consumer of prediction market data into someone who can actually read what the market is telling you.
Table 1: "The Five Structural Filters Between Price and Probability"
Factor | What It Distorts | Direction of Bias | Who's Most Affected | How Big Is the Effect |
|---|---|---|---|---|
Liquidity Depth | Thin markets amplify noise from single traders. AMM curves compress toward 50%. | Low volume → price drifts toward 50% or gets pushed by single large orders | Niche markets, entertainment, lower-tier sports, early-stage political markets | Massive. 84% accuracy above $100K volume vs. 61% below $10K. 23-point gap. |
Trader Composition | Different platforms attract different people with different information. Price reflects who's trading, not just what they know. | Kalshi skews economic/institutional. Polymarket skews crypto/geopolitical/global. | Cross-platform comparison. Any event priced on both venues. | Moderate. Typically 2-7% divergence on the same event between platforms. |
Fee Structure & Time Preference | Capital lock-up and transaction costs discourage long-dated positions. | Long-dated events → biased toward 50%. Traders discount distant outcomes. | Any market 3+ months from resolution. 2028 election, long-range economic forecasts. | Significant for distant events. 2028 presidential "dead heat" is partly time preference, not true uncertainty. |
Resolution Rules | Each platform writes its own rules. Same question can resolve differently. | Unpredictable — depends on fine print interpretation. | Any event with ambiguous language, death/violence carveouts, or subjective definitions. | Extreme when triggered. Cardi B: $57M, opposite answers. Khamenei: $54M, partial refunds. |
Regulatory Constraints | CFTC-regulated platforms can't list certain markets. Offshore platforms can list anything. | Regulated platforms have narrower market universes, affecting trader behavior and hedging options. | Geopolitical events, military outcomes, extreme tail risks. | Structural. The most granular probability data (strike targets, nuclear risk) exists only offshore. |
Factor #1: Liquidity Depth
This is the most powerful distortion — and the least understood.
Fensory's analysis of Polymarket data found that markets with over $100,000 in volume achieve 84% accuracy. Markets below $10,000 drop to 61%. That's not a small difference — it's the difference between a useful signal and noise.
Why? In thin markets, a single large trader can move the price significantly without any new information entering the market. A $5,000 buy order in a $10,000 market moves the price by 50%. The same order in a $10 million market barely registers. The price in the thin market doesn't reflect "what the crowd thinks." It reflects what one trader did.
Polymarket's automated market maker compounds this. In low-liquidity binary markets, AMM curves compress probabilities toward 50% — making uncertain events look like toss-ups even when available information suggests otherwise. Kalshi's order book model has less compression but faces its own liquidity fragmentation across thousands of markets.
What this means in practice: When you see a prediction market price on a niche event — a specific Cabinet appointment, a lower-tier sporting outcome, an entertainment market — check the volume before you trust the number. The price in a $500K+ market is structurally different information than the price in a $5K market, even if both display the same percentage.
Factor #2: Trader Composition
Kalshi requires KYC. Its trader base skews US-based, institutional-adjacent, and economically oriented. Polymarket's international exchange allows anonymous trading via crypto wallets. Its trader base includes global participants, crypto-native traders, and — as the Iran crisis demonstrated — potentially insiders using anonymous access.
These aren't just different people. They're different information sets. Kalshi's traders bring strengths in economic forecasting — recession odds, Fed rate expectations, financial market predictions. Polymarket's traders bring strengths in geopolitical events, crypto markets, and scenarios that require global perspective.
The 2024 Wharton study on prediction market interpretation demonstrated that when trader beliefs are widely dispersed, prediction market prices can deviate from mean beliefs. The more diverse (or the more homogeneous) the trader pool, the more the price reflects the composition of who's trading rather than an objective probability.
What this means in practice: When Kalshi shows recession at 34% and Polymarket shows it at 31%, the gap isn't noise. It's signal. Kalshi's economically-focused traders are pricing the recession risk higher than Polymarket's crypto-native base. The question isn't "which number is right" — it's "what does each trader pool know that the other doesn't?"
Factor #3: Fee Structure and Time Preference
Trading costs are invisible to the end consumer but they materially distort prices.
Polymarket charges zero trading fees but settles in USDC on Polygon — meaning traders bear gas costs and crypto conversion friction. Kalshi charges fees on trades and has fiat on/off ramps — lower friction for US users but direct cost on each transaction.
More significantly, both platforms require capital lock-up. If you buy a "Yes" contract at $0.65 on an event six months away, your $0.65 is locked until resolution. The opportunity cost of that capital creates what academics call "time preference bias" — documented in prediction market literature as pushing long-dated events toward 50%, regardless of the actual probability. Traders don't want to lock money for months. So they discount long-dated events, making distant outcomes look more uncertain than they are.
Wikipedia's prediction market entry cites this directly: "For events which take place further in time, prices are biased towards 50%. This bias comes from the traders' time preferences — their preferences not to lock their funds for a long time in assets."
What this means in practice: A 2028 presidential election market showing a "dead heat" at 50/50 may not mean the race is truly even. It may mean traders are discounting the event because it's two years away and capital has better uses in the meantime. The price is telling you about time preference as much as about probability.
Factor #4: Resolution Rules
This is the factor that creates the most explosive divergence between platforms — and the one most invisible to casual users.
The Cardi B Super Bowl market: $57 million wagered. Same question. Same broadcast. Polymarket resolved Yes (her appearance was a performance). Kalshi effectively resolved No (it wasn't). Two platforms, identical event, opposite answers.
The Khamenei market: Polymarket resolved Yes (he's dead, he's out). Kalshi invoked a death carveout (the rules say you can't profit from death). Same event. Different resolution. Class action lawsuit filed.
Resolution rules are set independently by each platform. They're buried in fine print. They vary by platform, by market, and sometimes by the interpretation of a single compliance officer on the day the event resolves. A price of $0.65 on Kalshi and $0.65 on Polymarket for the "same" question might reflect different definitions of the question, different resolution sources, and different carveout rules.
What this means in practice: The same price on two platforms can represent different bets. A trader who doesn't read the resolution rules on each platform isn't comparing apples to apples — they're comparing different contracts that happen to share a headline.
Factor #5: Regulatory Constraints
Kalshi is CFTC-regulated. It cannot list markets on assassinations, nuclear detonations, or certain military outcomes. Polymarket's international exchange operates offshore and can list anything.
This means the two platforms don't just have different trader bases — they have different market universes. The most granular geopolitical probability data (specific strike targets, regime change scenarios, nuclear risk) exists only on Polymarket. The most structured economic data (recession via NBER definition, Fed rate decisions, S&P 500 thresholds) is deepest on Kalshi.
When a media outlet publishes "prediction markets say there's a 37% chance of a ceasefire by April 15," they're publishing one platform's price from one regulatory environment. The same underlying question, priced on a platform with different regulatory constraints and different available markets, might produce a meaningfully different number — not because the probability is different, but because the structural context is different.
What this means in practice: The regulatory environment doesn't just affect which markets exist. It affects the prices of markets that exist on both platforms, because the surrounding market universe influences trader behavior, information flow, and hedging options.
What the Price Actually Is
So if the price isn't a probability, what is it?
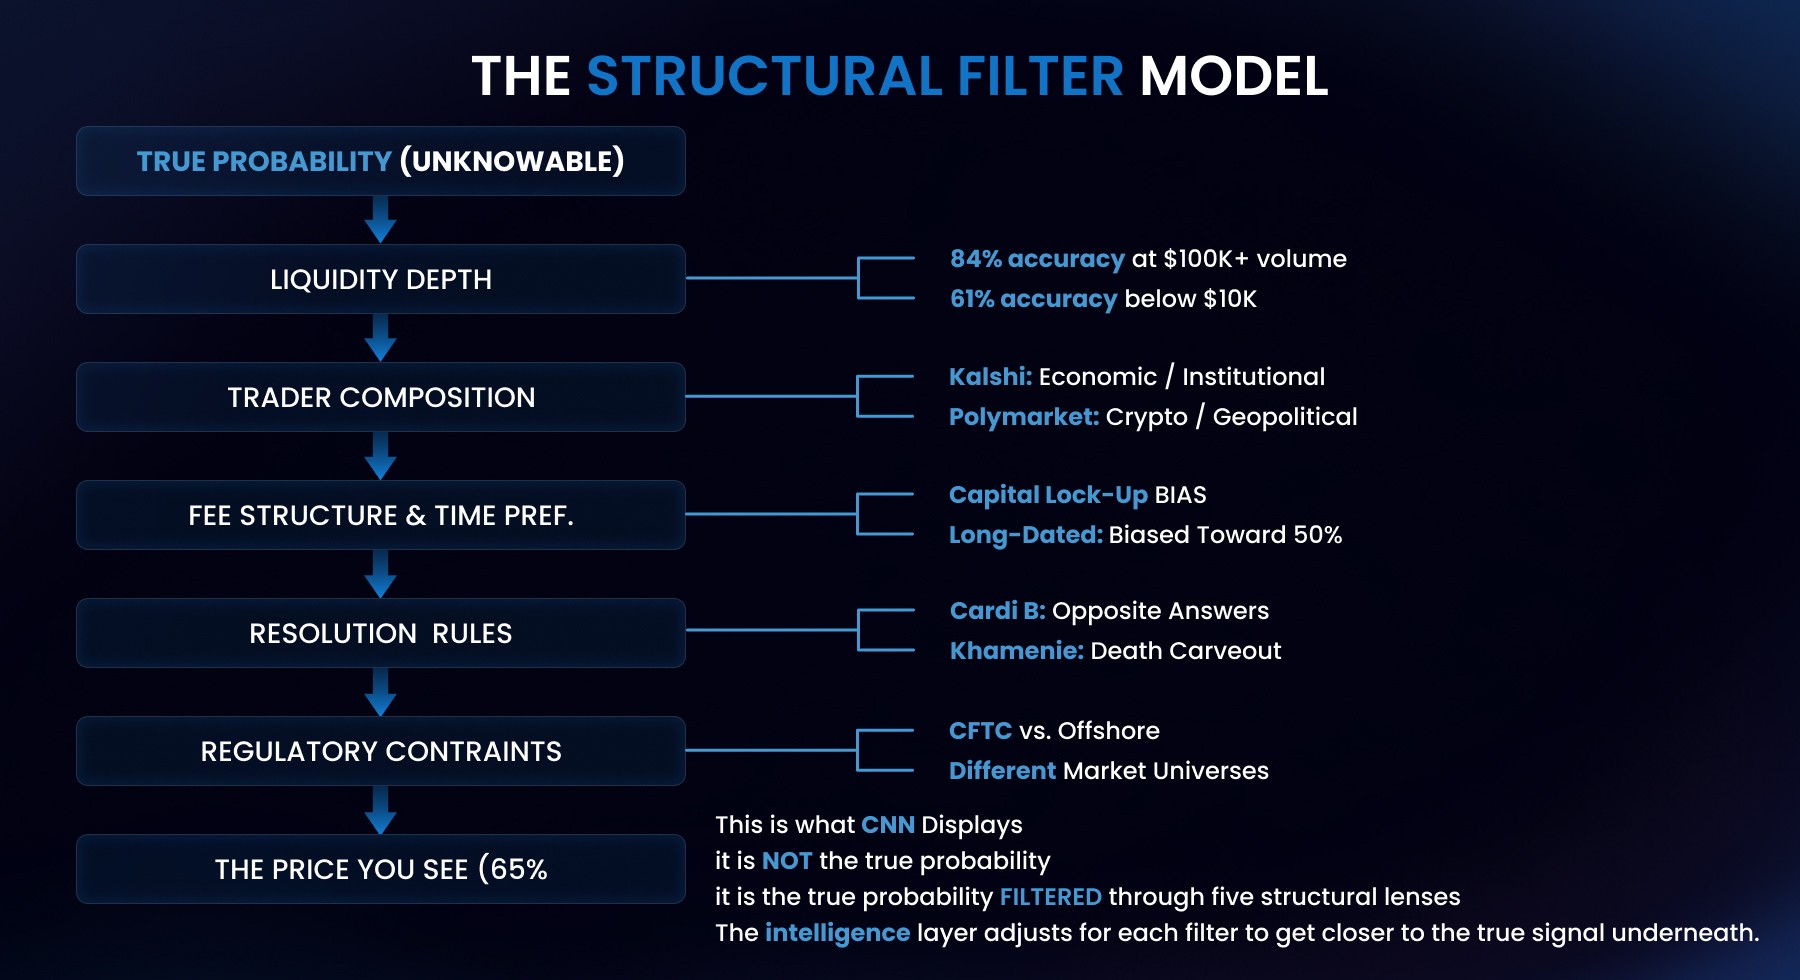
It's a probability estimate filtered through five structural lenses: liquidity depth, trader composition, fee structure and time preference, resolution rules, and regulatory constraints.
In high-liquidity markets with diverse trader bases, minimal fees, clear resolution rules, and similar regulatory environments, the price approximates probability closely. Fensory's data confirms this: 84% accuracy above $100K volume.
In low-liquidity markets with homogeneous traders, capital lock-up friction, ambiguous resolution, and divergent regulatory contexts, the price can deviate significantly from probability. The 61% accuracy in sub-$10K markets isn't a failure of prediction markets — it's the structural reality of what prices mean in constrained environments.
The value isn't in ignoring these distortions. It's in understanding them. When you know why two platforms show different prices for the same event, the divergence becomes information, not confusion. When you know that a long-dated event is biased toward 50% due to time preference, you can adjust for it. When you know that a thin market's price reflects one trader's opinion rather than crowd wisdom, you weight it accordingly.
The Structural Adjustment
Here's what changes when you stop treating prices as probabilities and start treating them as structurally-filtered signals:
Table 2: "How to Read a Prediction Market Price: Raw vs. Adjusted"
What You See | What Most People Think | What It Actually Means | What To Do |
|---|---|---|---|
65% on Kalshi | "There's a 65% chance this happens." | 65% according to Kalshi's trader base, at Kalshi's liquidity depth, under Kalshi's resolution rules. | Check if Polymarket shows a different number. The divergence IS the signal. |
50/50 on a 2028 election | "It's a dead heat, nobody knows." | Time preference bias. Traders don't want to lock capital for 2 years. The price is discounted for time, not just uncertainty. | Adjust upward for any candidate with structural advantages. The "dead heat" overstates true uncertainty. |
70% on a $5,000 market | "Probably going to happen." | One or two traders set this price. Volume is too thin for the number to mean anything. | Ignore or heavily discount. Below $50K volume, prices are noise, not signal. |
Same event, 65% on Kalshi, 58% on Polymarket | "One of them is wrong." | Both are right — for their respective trader pools. The 7-point gap tells you the two pools are processing information differently. | Ask WHY they diverge. Kalshi's economic traders and Polymarket's geopolitical traders are weighting different factors. The gap is more valuable than either number. |
Probability spikes 15 points in an hour | "Something big happened." | Maybe. Or one whale moved a thin market. Check if volume spiked proportionally. | If volume didn't spike with price, it's a liquidity event, not an information event. Fade it. |
Kalshi says Yes, Polymarket says No | "Broken system." | Different resolution rules. Same event, different contractual definitions of the outcome. | Read the fine print on both platforms BEFORE trading. The "same question" is often two different contracts. |
Instead of asking "what's the probability?" you ask "what's this price telling me given this platform's liquidity, traders, fees, resolution rules, and regulatory context?"
Instead of looking at one number, you look at the spread between platforms and ask what the divergence reveals about different trader pools processing the same information.
Instead of trusting a 65% at face value, you check the volume, check the resolution rules, check the time horizon, and arrive at a structurally-adjusted estimate that's more accurate than any single raw price.
This is what an intelligence layer does. It doesn't just aggregate prices across platforms. It adjusts for the structural factors that make those prices deviate from probability. It turns raw prices into calibrated signals.
The raw data has never been richer — $65 billion traded in 2026, $6.5 billion in a single week, 74,836 active markets. But the gap between what the data shows and what the data means is wider than most people realize.
The price is not the probability. It's the starting point.
This is the tenth installment in the Assymetrix Intelligence Brief series.
Previous: "10 Prediction Market Numbers That Explain This Week"
Assymetrix is building the intelligence and synthesis layer for prediction markets — not just aggregating prices, but adjusting for the structural factors that make them meaningful.


