Measure Liquidity Fragmentation in Prediction Markets for Quants
Measure Liquidity Fragmentation in Prediction Markets for Quants
Measure Liquidity Fragmentation in Prediction Markets for Quants
Developer-facing guide for prediction market quants to detect and fix liquidity fragmentation using canonical IDs, aggregated timeseries, and a cross...

Measure Liquidity Fragmentation in Prediction Markets for Quants
Liquidity fragmentation occurs when equivalent claim liquidity is split across venues, raising execution cost and producing persistent cross-venue price divergence unless you aggregate or align event identity. For quants and developers, the practical fix is not picking a winning venue: it is measuring cross-venue divergence and canonicalizing event identity before trusting any single-venue signal.
TL;DR:
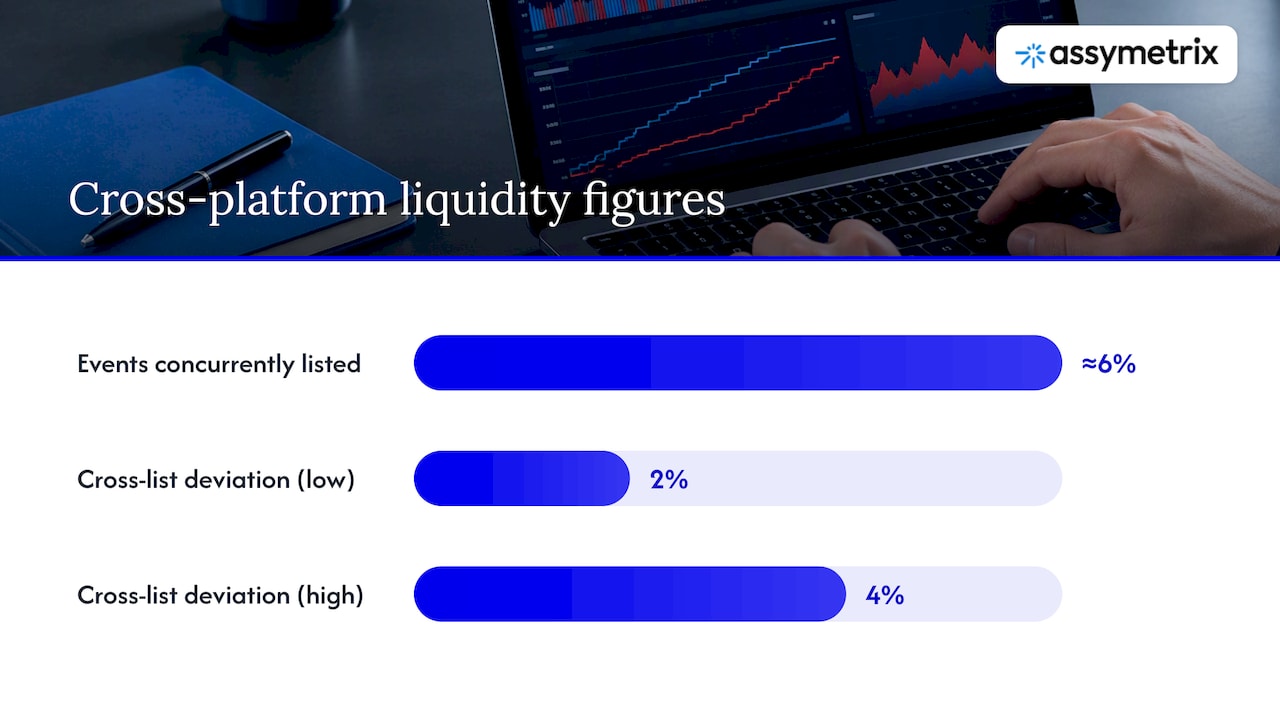
Only about 6% of events appear on multiple platforms, and matched listings still diverge by roughly 2% to 4%, especially for long lived, high salience events.
Require a confirmed canonical event match before sizing a position spanning venues; otherwise, arbitrage may compare contracts with different deadlines or resolution rules.
Track price deviations after execution costs, geometric mean volume across matched venues, event alignment rate, and convergence time to distinguish tradable spreads from persistent gaps.
Aggregate depth can rise as venues multiply, then fall as search and coordination costs grow, so estimate the optimal venue count from your own market.
Fees and holding period opportunity costs can erase a quoted spread, while venue specific resolution rules may leave a hedged position exposed to basis risk.
AssymetrixMeasure Cross-Venue Market DivergenceAssymetrix brings prediction market data from Polymarket, Kalshi, and Limitless together through one Data API integration.Explore the Data API
Table of Contents
What liquidity fragmentation means for local and global depth
Why fragmentation matters: cost, informativeness, and power
Semantic non-fungibility and jump-to-resolution risk in prediction markets
Metrics and monitoring: how to detect fragmentation before it costs you
How practitioners handle fragmentation in data and execution
Assymetrix: a data layer built for cross-venue measurement
Perspective: when to aggregate and when to let fragmentation be
Try the cross-venue Data API behind this analysis
Sources
What liquidity fragmentation means for local and global depth
Liquidity fragmentation describes a market structure in which trading interest for economically equivalent claims splits across multiple venues instead of pooling in one order book. This splitting changes how depth behaves depending on where you look.
Two distinct concepts matter here, and conflating them leads to bad sizing decisions:
Local liquidity: the depth available on a single venue, the number that determines your slippage on any order routed there alone.
Global liquidity: the aggregate depth across all venues trading the same or equivalent claim, the number that determines the true cost of filling a large position if you could route freely.
Theoretical and empirical work on this question finds that local liquidity on any given exchange falls as fragmentation increases, while global liquidity can actually rise with the number of venues, up to a point. Research modeling this relationship describes an inverted-U pattern between fragmentation and liquidity. Aggregate depth improves as venues multiply, reaches an optimal count of exchanges, and then declines as coordination costs and search frictions outweigh the benefit of additional venues. A desk pricing a position only from one book sees the local decline. A desk capable of routing across venues sees the global curve, and the difference between those two views is the entire fragmentation problem in a single chart.
Why fragmentation matters: cost, informativeness, and power
Fragmentation is not a cosmetic market-structure detail. It reshapes three things a trading desk actually prices: execution cost, the information content of any single quote, and who controls the choke points where capital crosses venues.
Execution cost rises on the local book even when aggregate depth looks healthy, because your order only interacts with the liquidity actually present where you route it.
Price informativeness behaves counterintuitively: aggregating prices across fragmented venues can produce a more accurate global probability estimate than any single venue offers, even though each individual exchange’s quote becomes noisier in isolation, according to research on market fragmentation and price informativeness. That means a signal built from one venue’s price is strictly worse than a signal built from the aggregate, and teams building probability models should treat single-venue quotes as a sampling problem rather than ground truth.
Market power concentrates at the bridges, resolvers, and settlement points that connect otherwise-isolated pools, because those choke points become the only route for capital to correct a cross-venue dislocation, which raises basis risk for anyone trying to arbitrage through them.
Semantically equivalent events listed on separate platforms show persistent, execution-aware price deviations of roughly 2 to 4 percent on average. That gap is not noise that resolves itself; it is the structural residue of fragmentation, and it sits squarely inside the range a desk should expect to pay (or capture) when crossing venues without a canonicalization layer.
Semantic non-fungibility and jump-to-resolution risk in prediction markets
Prediction markets add a wrinkle that equity or futures fragmentation research does not fully capture: semantic non-fungibility. Two listings can describe the identical real-world event and still trade as entirely different assets because resolution wording, deadlines, or settlement sources differ slightly across platforms. A contract resolving on “will X happen by March 31” is not fungible with one resolving on “will X happen in Q1” even when the underlying question is functionally the same to a human reader. Order-matching engines do not know that; they only know contract identifiers.
This has concrete operational consequences:
Capital cannot net across listings that look equivalent but are not canonically matched, so arbitrage desks must explicitly build the mapping rather than assume the market will self-correct.
Liquidity stays thin on each separate listing even when combined volume across platforms would look deep, because no single order book receives the full flow.
Mispricing persists longer than in fungible-asset markets, since the usual cross-exchange arbitrage mechanism requires first establishing that two listings are, in fact, the same claim.
A large cross-platform dataset shows only about 6 percent of events are concurrently listed across platforms at all, and those that are concurrently listed still show the 2 to 4 percent deviation noted above, concentrated in long-lived, high-salience events where you would expect arbitrage to be most active.
Automated market makers compound this. A SoK on decentralized prediction market microstructure notes that AMM pools can be drained faster than liquidity providers can withdraw when an event resolves abruptly. Scheduled tapering mechanisms such as pm-AMM reduce exposure as a known expiry approaches, but they do nothing for an event that resolves on an unscheduled news jump, which is common in prediction markets tied to real-world outcomes.
Metrics and monitoring: how to detect fragmentation before it costs you
Detecting fragmentation is a measurement problem before it is a trading problem. A workable monitoring stack needs four kinds of signals, in this order:
Cross-venue percent deviation: the execution-adjusted gap between quoted prices for canonically matched events across venues, tracked as a rolling series rather than a point estimate.
Effective (global) liquidity: computed as the geometric mean of volume across matched venues, which penalizes imbalance between a deep venue and a thin one more fairly than a simple sum.
Event-alignment rate: the share of events that have a confirmed canonical match across venues, since a low alignment rate means most of your universe is not even eligible for cross-venue arbitrage.
Time-to-convergence: how long a detected deviation persists before it closes, which tells you whether a spread is a tradable inefficiency or a structural feature of that event pair.
Building these metrics in production means a pipeline that assigns canonical IDs to equivalent events first, computes rolling deviation against a configured threshold second, and triggers automated alerts for capital allocation third, rather than trying to detect fragmentation ad hoc inside a strategy backtest. Our liquidity metrics guide covers depth measures that feed directly into this pipeline.
Pro Tip: Treat alignment rate as a gating variable: never size a cross-venue position until the pair has a confirmed canonical match, regardless of how attractive the quoted deviation looks.
How practitioners handle fragmentation in data and execution
Handling fragmentation well means building two layers: a data layer that establishes what is actually the same claim, and an execution layer that routes orders knowing the true aggregate depth behind them.
On the data side, the core components are canonical IDs assigned through a semantic-matching pipeline, normalized schemas so fields mean the same thing across venues, and continuous cross-venue aggregation so a query returns combined depth rather than one venue’s slice of it. A semantic alignment pipeline combining natural-language matching, resolution-semantic parsing, and temporal-scope filters is what produces human-validated canonical mappings at scale, rather than a brittle keyword match that breaks on the next wording variant.
On the execution side:
Smart order routing that consumes normalized, canonicalized liquidity rather than raw single-venue order books, so routing decisions reflect true depth.
Order splitting across matched venues to avoid moving one thin book when aggregate depth would absorb the order comfortably.
Expiry tapering for AMM-based positions, reducing exposure as a scheduled resolution date nears, while still budgeting separately for unscheduled jump risk.
Conditional routing that only crosses venues once alignment and deviation checks clear a threshold, not on price alone.
A practical build for the scanning side of this is covered in our cross-venue arbitrage scanner guide. For execution cost modeling specifically, slippage estimation deserves its own treatment, which we cover in a dedicated note on estimating execution cost. Traders doing chart-based liquidity zone analysis as a complement to API-driven monitoring can also look at liquidity zone detection techniques for a visual cross-check.
The failure modes are consistent: netting is impossible without canonical matching, platform-specific resolution rules introduce basis risk that a hedge cannot fully remove, and fee structures routinely eat a deviation that looked profitable on a raw price chart. A case study on basis-risk arbitrage around the Digital Asset Market Clarity Act found hedged positions could remain profitable after fees in selected pairs, but returns stayed highly sensitive to platform-specific resolution rules and holding-period opportunity cost.
Pro Tip: Model fee drag and opportunity cost before the deviation itself when evaluating a cross-venue trade; the spread is the easy number to find, the cost structure is the one that actually determines profitability.
Assymetrix: a data layer built for cross-venue measurement
A Data API built around the canonicalization and measurement problem described above delivers:
Normalized cross-venue timeseries spanning major prediction market venues on a single schema.
Canonical event mapping so semantically equivalent listings resolve to one ID across venues.
Effective liquidity and slippage estimates computed from aggregated depth rather than single-venue books.
Signals representing smart money and trader skill layered on top of normalized data.
Use cases include a cross-venue arbitrage scanner that flags canonically matched pairs crossing a deviation threshold, and a slippage estimator that feeds execution-cost assumptions into a smart order router’s cost model. These utilize extensive historical data covering significant trading activity.
Perspective: when to aggregate and when to let fragmentation be
The inverted-U result is the right heuristic: consolidate when you are below the optimal venue count, where global liquidity is still climbing, and switch to fragmentation-aware routing once you are past it, where adding venues adds friction instead of depth. Estimate your own E* empirically rather than assuming it; monitor effective liquidity continuously, and default to aggregation whenever concurrent-listing rates or deviation readings cross your configured threshold. Jump-to-resolution risk and fee traps are the two caveats that break clean theory most often.
— Dean
Try the cross-venue Data API behind this analysis
We built our Data API specifically so developers and quant teams do not have to build the canonicalization layer themselves before they can even start measuring fragmentation. It supplies canonical IDs, normalized cross-venue timeseries, historical backfill, and Smart Money signals through one integration, covering Polymarket, Kalshi, and Limitless.

A trial key gets you a sample dataset and integration guides, so you can wire up a deviation monitor or an arbitrage scanner against real cross-venue data in an afternoon rather than a quarter. Start with the Data API documentation and build from the sample feed.
FAQ
What is liquidity fragmentation?
Liquidity fragmentation happens when trading interest for the same or equivalent claim splits across multiple venues instead of concentrating on one order book. It lowers depth on any single venue (local liquidity) while sometimes raising combined depth across all venues (global liquidity), up to an optimal number of venues described in the inverted-U liquidity model.
Can you give me an example of a fragmented market?
A prediction market where the same real-world event is listed separately on multiple platforms with slightly different resolution wording is a textbook case, a pattern called semantic non-fungibility. Research on this effect found persistent price deviations of roughly 2 to 4 percent between such listings even though they describe the same outcome.
What are the three types of liquidity?
In the fragmentation literature, the relevant distinction is usually local liquidity (depth on one venue), global or effective liquidity (aggregate depth across matched venues), and execution liquidity (what you can actually fill at a given cost once slippage and fees apply). Monitoring all three, rather than local depth alone, is what the effective liquidity framework recommends.
What does fragmented market mean?
A fragmented market is one where buyers and sellers of equivalent claims are split across separate trading venues rather than meeting in one consolidated order book. This split typically raises execution cost on any single venue and can distort price informativeness unless prices are aggregated across venues, as shown in research on fragmentation and price informativeness.
Sources
Measure Liquidity Fragmentation in Prediction Markets for Quants
Liquidity fragmentation occurs when equivalent claim liquidity is split across venues, raising execution cost and producing persistent cross-venue price divergence unless you aggregate or align event identity. For quants and developers, the practical fix is not picking a winning venue: it is measuring cross-venue divergence and canonicalizing event identity before trusting any single-venue signal.
TL;DR:
Only about 6% of events appear on multiple platforms, and matched listings still diverge by roughly 2% to 4%, especially for long lived, high salience events.
Require a confirmed canonical event match before sizing a position spanning venues; otherwise, arbitrage may compare contracts with different deadlines or resolution rules.
Track price deviations after execution costs, geometric mean volume across matched venues, event alignment rate, and convergence time to distinguish tradable spreads from persistent gaps.
Aggregate depth can rise as venues multiply, then fall as search and coordination costs grow, so estimate the optimal venue count from your own market.
Fees and holding period opportunity costs can erase a quoted spread, while venue specific resolution rules may leave a hedged position exposed to basis risk.
AssymetrixMeasure Cross-Venue Market DivergenceAssymetrix brings prediction market data from Polymarket, Kalshi, and Limitless together through one Data API integration.Explore the Data API
Table of Contents
What liquidity fragmentation means for local and global depth
Why fragmentation matters: cost, informativeness, and power
Semantic non-fungibility and jump-to-resolution risk in prediction markets
Metrics and monitoring: how to detect fragmentation before it costs you
How practitioners handle fragmentation in data and execution
Assymetrix: a data layer built for cross-venue measurement
Perspective: when to aggregate and when to let fragmentation be
Try the cross-venue Data API behind this analysis
Sources
What liquidity fragmentation means for local and global depth
Liquidity fragmentation describes a market structure in which trading interest for economically equivalent claims splits across multiple venues instead of pooling in one order book. This splitting changes how depth behaves depending on where you look.
Two distinct concepts matter here, and conflating them leads to bad sizing decisions:
Local liquidity: the depth available on a single venue, the number that determines your slippage on any order routed there alone.
Global liquidity: the aggregate depth across all venues trading the same or equivalent claim, the number that determines the true cost of filling a large position if you could route freely.
Theoretical and empirical work on this question finds that local liquidity on any given exchange falls as fragmentation increases, while global liquidity can actually rise with the number of venues, up to a point. Research modeling this relationship describes an inverted-U pattern between fragmentation and liquidity. Aggregate depth improves as venues multiply, reaches an optimal count of exchanges, and then declines as coordination costs and search frictions outweigh the benefit of additional venues. A desk pricing a position only from one book sees the local decline. A desk capable of routing across venues sees the global curve, and the difference between those two views is the entire fragmentation problem in a single chart.
Why fragmentation matters: cost, informativeness, and power
Fragmentation is not a cosmetic market-structure detail. It reshapes three things a trading desk actually prices: execution cost, the information content of any single quote, and who controls the choke points where capital crosses venues.
Execution cost rises on the local book even when aggregate depth looks healthy, because your order only interacts with the liquidity actually present where you route it.
Price informativeness behaves counterintuitively: aggregating prices across fragmented venues can produce a more accurate global probability estimate than any single venue offers, even though each individual exchange’s quote becomes noisier in isolation, according to research on market fragmentation and price informativeness. That means a signal built from one venue’s price is strictly worse than a signal built from the aggregate, and teams building probability models should treat single-venue quotes as a sampling problem rather than ground truth.
Market power concentrates at the bridges, resolvers, and settlement points that connect otherwise-isolated pools, because those choke points become the only route for capital to correct a cross-venue dislocation, which raises basis risk for anyone trying to arbitrage through them.
Semantically equivalent events listed on separate platforms show persistent, execution-aware price deviations of roughly 2 to 4 percent on average. That gap is not noise that resolves itself; it is the structural residue of fragmentation, and it sits squarely inside the range a desk should expect to pay (or capture) when crossing venues without a canonicalization layer.
Semantic non-fungibility and jump-to-resolution risk in prediction markets
Prediction markets add a wrinkle that equity or futures fragmentation research does not fully capture: semantic non-fungibility. Two listings can describe the identical real-world event and still trade as entirely different assets because resolution wording, deadlines, or settlement sources differ slightly across platforms. A contract resolving on “will X happen by March 31” is not fungible with one resolving on “will X happen in Q1” even when the underlying question is functionally the same to a human reader. Order-matching engines do not know that; they only know contract identifiers.
This has concrete operational consequences:
Capital cannot net across listings that look equivalent but are not canonically matched, so arbitrage desks must explicitly build the mapping rather than assume the market will self-correct.
Liquidity stays thin on each separate listing even when combined volume across platforms would look deep, because no single order book receives the full flow.
Mispricing persists longer than in fungible-asset markets, since the usual cross-exchange arbitrage mechanism requires first establishing that two listings are, in fact, the same claim.
A large cross-platform dataset shows only about 6 percent of events are concurrently listed across platforms at all, and those that are concurrently listed still show the 2 to 4 percent deviation noted above, concentrated in long-lived, high-salience events where you would expect arbitrage to be most active.
Automated market makers compound this. A SoK on decentralized prediction market microstructure notes that AMM pools can be drained faster than liquidity providers can withdraw when an event resolves abruptly. Scheduled tapering mechanisms such as pm-AMM reduce exposure as a known expiry approaches, but they do nothing for an event that resolves on an unscheduled news jump, which is common in prediction markets tied to real-world outcomes.
Metrics and monitoring: how to detect fragmentation before it costs you
Detecting fragmentation is a measurement problem before it is a trading problem. A workable monitoring stack needs four kinds of signals, in this order:
Cross-venue percent deviation: the execution-adjusted gap between quoted prices for canonically matched events across venues, tracked as a rolling series rather than a point estimate.
Effective (global) liquidity: computed as the geometric mean of volume across matched venues, which penalizes imbalance between a deep venue and a thin one more fairly than a simple sum.
Event-alignment rate: the share of events that have a confirmed canonical match across venues, since a low alignment rate means most of your universe is not even eligible for cross-venue arbitrage.
Time-to-convergence: how long a detected deviation persists before it closes, which tells you whether a spread is a tradable inefficiency or a structural feature of that event pair.
Building these metrics in production means a pipeline that assigns canonical IDs to equivalent events first, computes rolling deviation against a configured threshold second, and triggers automated alerts for capital allocation third, rather than trying to detect fragmentation ad hoc inside a strategy backtest. Our liquidity metrics guide covers depth measures that feed directly into this pipeline.
Pro Tip: Treat alignment rate as a gating variable: never size a cross-venue position until the pair has a confirmed canonical match, regardless of how attractive the quoted deviation looks.
How practitioners handle fragmentation in data and execution
Handling fragmentation well means building two layers: a data layer that establishes what is actually the same claim, and an execution layer that routes orders knowing the true aggregate depth behind them.
On the data side, the core components are canonical IDs assigned through a semantic-matching pipeline, normalized schemas so fields mean the same thing across venues, and continuous cross-venue aggregation so a query returns combined depth rather than one venue’s slice of it. A semantic alignment pipeline combining natural-language matching, resolution-semantic parsing, and temporal-scope filters is what produces human-validated canonical mappings at scale, rather than a brittle keyword match that breaks on the next wording variant.
On the execution side:
Smart order routing that consumes normalized, canonicalized liquidity rather than raw single-venue order books, so routing decisions reflect true depth.
Order splitting across matched venues to avoid moving one thin book when aggregate depth would absorb the order comfortably.
Expiry tapering for AMM-based positions, reducing exposure as a scheduled resolution date nears, while still budgeting separately for unscheduled jump risk.
Conditional routing that only crosses venues once alignment and deviation checks clear a threshold, not on price alone.
A practical build for the scanning side of this is covered in our cross-venue arbitrage scanner guide. For execution cost modeling specifically, slippage estimation deserves its own treatment, which we cover in a dedicated note on estimating execution cost. Traders doing chart-based liquidity zone analysis as a complement to API-driven monitoring can also look at liquidity zone detection techniques for a visual cross-check.
The failure modes are consistent: netting is impossible without canonical matching, platform-specific resolution rules introduce basis risk that a hedge cannot fully remove, and fee structures routinely eat a deviation that looked profitable on a raw price chart. A case study on basis-risk arbitrage around the Digital Asset Market Clarity Act found hedged positions could remain profitable after fees in selected pairs, but returns stayed highly sensitive to platform-specific resolution rules and holding-period opportunity cost.
Pro Tip: Model fee drag and opportunity cost before the deviation itself when evaluating a cross-venue trade; the spread is the easy number to find, the cost structure is the one that actually determines profitability.
Assymetrix: a data layer built for cross-venue measurement
A Data API built around the canonicalization and measurement problem described above delivers:
Normalized cross-venue timeseries spanning major prediction market venues on a single schema.
Canonical event mapping so semantically equivalent listings resolve to one ID across venues.
Effective liquidity and slippage estimates computed from aggregated depth rather than single-venue books.
Signals representing smart money and trader skill layered on top of normalized data.
Use cases include a cross-venue arbitrage scanner that flags canonically matched pairs crossing a deviation threshold, and a slippage estimator that feeds execution-cost assumptions into a smart order router’s cost model. These utilize extensive historical data covering significant trading activity.
Perspective: when to aggregate and when to let fragmentation be
The inverted-U result is the right heuristic: consolidate when you are below the optimal venue count, where global liquidity is still climbing, and switch to fragmentation-aware routing once you are past it, where adding venues adds friction instead of depth. Estimate your own E* empirically rather than assuming it; monitor effective liquidity continuously, and default to aggregation whenever concurrent-listing rates or deviation readings cross your configured threshold. Jump-to-resolution risk and fee traps are the two caveats that break clean theory most often.
— Dean
Try the cross-venue Data API behind this analysis
We built our Data API specifically so developers and quant teams do not have to build the canonicalization layer themselves before they can even start measuring fragmentation. It supplies canonical IDs, normalized cross-venue timeseries, historical backfill, and Smart Money signals through one integration, covering Polymarket, Kalshi, and Limitless.
A trial key gets you a sample dataset and integration guides, so you can wire up a deviation monitor or an arbitrage scanner against real cross-venue data in an afternoon rather than a quarter. Start with the Data API documentation and build from the sample feed.
FAQ
What is liquidity fragmentation?
Liquidity fragmentation happens when trading interest for the same or equivalent claim splits across multiple venues instead of concentrating on one order book. It lowers depth on any single venue (local liquidity) while sometimes raising combined depth across all venues (global liquidity), up to an optimal number of venues described in the inverted-U liquidity model.
Can you give me an example of a fragmented market?
A prediction market where the same real-world event is listed separately on multiple platforms with slightly different resolution wording is a textbook case, a pattern called semantic non-fungibility. Research on this effect found persistent price deviations of roughly 2 to 4 percent between such listings even though they describe the same outcome.
What are the three types of liquidity?
In the fragmentation literature, the relevant distinction is usually local liquidity (depth on one venue), global or effective liquidity (aggregate depth across matched venues), and execution liquidity (what you can actually fill at a given cost once slippage and fees apply). Monitoring all three, rather than local depth alone, is what the effective liquidity framework recommends.
What does fragmented market mean?
A fragmented market is one where buyers and sellers of equivalent claims are split across separate trading venues rather than meeting in one consolidated order book. This split typically raises execution cost on any single venue and can distort price informativeness unless prices are aggregated across venues, as shown in research on fragmentation and price informativeness.
Sources
Other Blog


