Assymetrix: Estimate Slippage in Prediction Markets for Devs & Quants
Assymetrix: Estimate Slippage in Prediction Markets for Devs & Quants
Assymetrix: Estimate Slippage in Prediction Markets for Devs & Quants
Build a pre trade slippage estimator for prediction markets. Use live order book depth and the Assymetrix Data API to quantify execution cost before you...

Assymetrix: Estimate Slippage in Prediction Markets for Devs & Quants
Slippage in prediction markets is the gap between the displayed price and your average executed price once an order consumes real order-book depth. It ties directly to implied probability, so every basis point of slippage is a direct subtraction from model edge. This guide walks through the mechanics, the math, and a live-data workflow for estimating slippage before you place an order.
TL;DR:
Slippage increases significantly when trading more than 20% of the available order-book depth, especially in thin or near-expiry markets.
Larger orders can cause slippage of several cents per contract, which may substantially reduce your model’s implied edge.
Market timing, order slicing, and limit orders help mitigate slippage, but they add operational complexity and execution risk.
Accurate pre-trade slippage estimation requires real-time order-book snapshots and simulation of order consumption to adjust position size accordingly.
Using automated APIs for live and historical depth data enables better modeling of slippage risks across prediction market venues.
AssymetrixModel Slippage With Unified Market DataAssymetrix brings real-time and historical prediction market data across Polymarket, Kalshi, and Limitless into one intelligence layer.Explore Assymetrix
Table of Contents
What Slippage Means in Prediction Markets
Why Slippage Behaves Differently in Prediction Markets
Measuring and Modeling Slippage from Order-Book Depth
Practical Execution Tactics to Limit Slippage
Building a Pre-Trade Slippage Estimator With the Assymetrix Data API
A Practitioner’s Pre-Deploy Checklist
Get Live Depth Data for Slippage Modeling
Sources
What Slippage Means in Prediction Markets
Slippage is the difference between the price quoted at the top of the book and the average price you actually pay once your order fills across multiple levels of depth. In a market pricing a binary event, that top-of-book quote functions as an implied probability, so slippage doesn’t just cost you money, it drags your entry price away from the probability your model actually estimated. A sourced explainer on prediction market slippage frames it plainly: the cause is a mix of thin liquidity, oversized orders relative to that liquidity, and the mechanics of whatever execution model the venue runs.
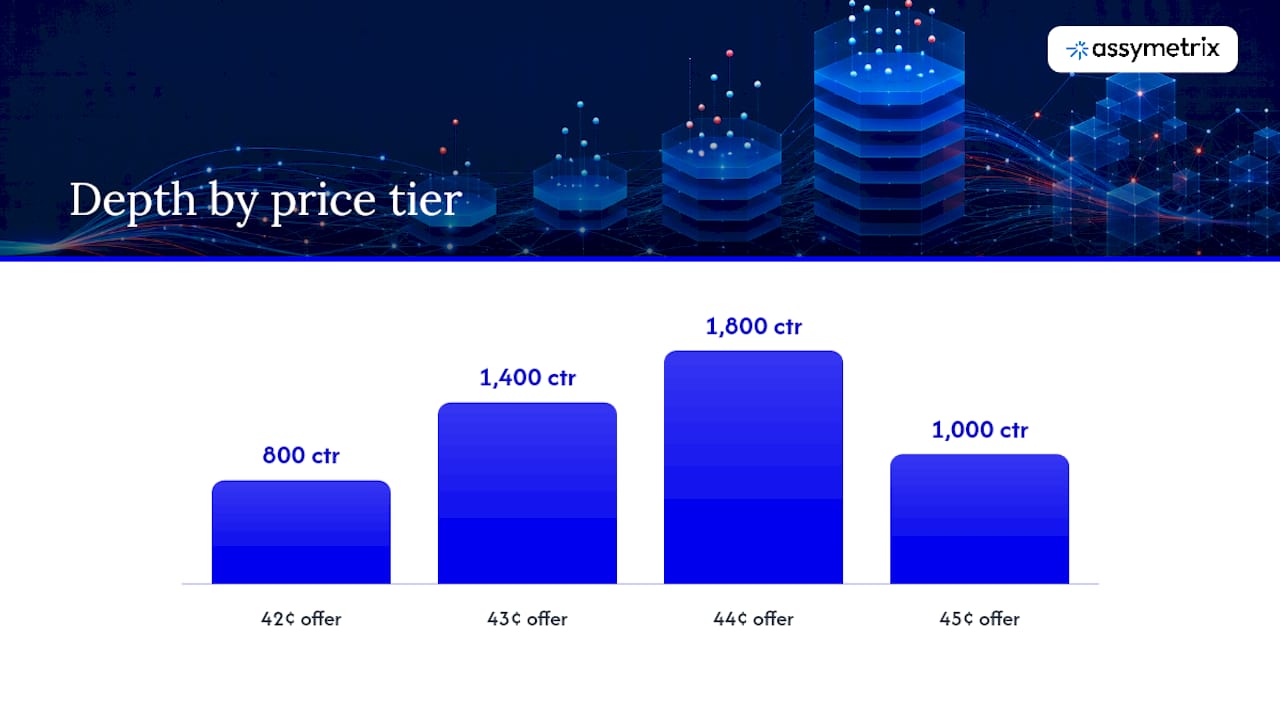
Here’s a worked example. Suppose a market shows a best offer of 42 cents for “Yes,” and you want to buy a large number of contracts. The book might look like this:
800 contracts available at 42 cents
1,400 contracts available at 43 cents
1,800 contracts available at 44 cents
1,000 contracts available at 45 cents (the remainder needed to fill 5,000)
Your average fill price becomes the volume-weighted average price across those tiers, resulting in a small slippage amount per contract against the quoted 42 cents, equating to a meaningful total cost on the full order. If your model’s fair value was 44 cents, your real edge just shrank from 2 cents to 0.56 cents before you’ve paid a single explicit fee.
Slippage is distinct from both the bid-ask spread and platform fees, though all three erode the same edge. Spread is the static gap between best bid and best offer, visible before you trade. Fees are contractual and usually fixed. Slippage is dynamic. It scales with your order size relative to the depth sitting in front of it, which means the same market can be cheap to trade at 100 contracts and expensive at 5,000.
Why Slippage Behaves Differently in Prediction Markets
Prediction markets price everything between 0 and 100 (or 0 and 1), and that bound changes how slippage functions compared to unbounded asset markets. A 2 cent move on a stock trading at $150 is trivial. A 2 cent move on a contract priced at 8 cents is a 25% relative price change, and it’s an even larger swing in implied probability terms near the extremes, where the market is most sensitive to new information.
Several forces make this worse in practice, and they compound rather than operate in isolation:
Bounded pricing amplifies percentage cost. The closer a contract trades to 0 or 100, the more a fixed-cent slippage amount distorts the percentage cost and the underlying probability estimate.
Liquidity concentrates and then evaporates near expiry. Niche or long-tail markets often carry thin books for most of their life, then see a burst of activity as resolution nears, followed by liquidity that can disappear entirely once the outcome becomes near-certain.
Execution model shapes the slippage curve. A comparison of CLOB and AMM mechanics notes that central limit order books force large orders to “walk the book” through discrete price tiers, while automated market makers push price along a continuous curve, often producing steeper price impact per unit size for a given amount of liquidity.
Volatility spikes around news events compress your reaction window. A breaking headline can move a market several cents in seconds, turning a previously calm order-book snapshot stale before your order routes.
The practical consequence is that slippage modeling in prediction markets can’t borrow wholesale from equities or futures playbooks. A model that treats liquidity as roughly constant will systematically underprice execution risk in markets where depth is a function of time-to-resolution, not just trading volume. Any pre-trade estimate has to account for where a market sits on its own liquidity lifecycle, not just its current book snapshot.
Measuring and Modeling Slippage from Order-Book Depth
Modeling slippage starts with treating the order book as a queue of price tiers, each with a finite volume, and simulating how your order consumes them in sequence. This is the same cumulative-depth approach used in the worked example above, just generalized into a repeatable calculation you can run before every trade.
What you need from a depth snapshot. At minimum: price level, volume available at that level, and a timestamp close enough to execution time that the snapshot hasn’t gone stale. A practical liquidity calculator methodology recommends running this check whenever your intended order size exceeds roughly 20% of visible depth, since below that threshold slippage tends to be negligible on most active markets.
The deterministic formula for expected average fill price is straightforward:
Sort book levels by price in the direction of your trade (ascending for buys, descending for sells).
Walk down the levels, accumulating volume until you reach your target order size, splitting the final level if it only partially fills your order.
Compute average fill price as the volume-weighted mean across all consumed levels:
sum(price_i * volume_i) / total_order_size.Subtract the top-of-book price from that average to get slippage per contract, then multiply by order size for total dollar slippage.
Pro Tip: Run this calculation against live snapshots, not delayed ones. A book that looked deep three seconds ago can thin out fast once a large order or a news-driven wave of activity hits it, especially in the hours before resolution.
For markets where you don’t have full depth granularity, a parametric price-impact approximation can substitute, modeling expected slippage as a function proportional to order size divided by available depth, calibrated against historical fills. This is faster to compute at scale but less precise than a direct book simulation, so it works best as a screening tool to flag markets worth a full depth check rather than a final execution decision.
Monte Carlo simulation adds a layer that a static snapshot can’t: fill uncertainty from latency and order-arrival risk. Between the moment you pull a depth snapshot and the moment your order actually reaches the matching engine, other participants may have consumed some of that depth. Running repeated draws over plausible depth-depletion scenarios, informed by historical fill data, gives you a distribution of likely average fill prices rather than a single point estimate, which matters more the longer your execution latency runs.
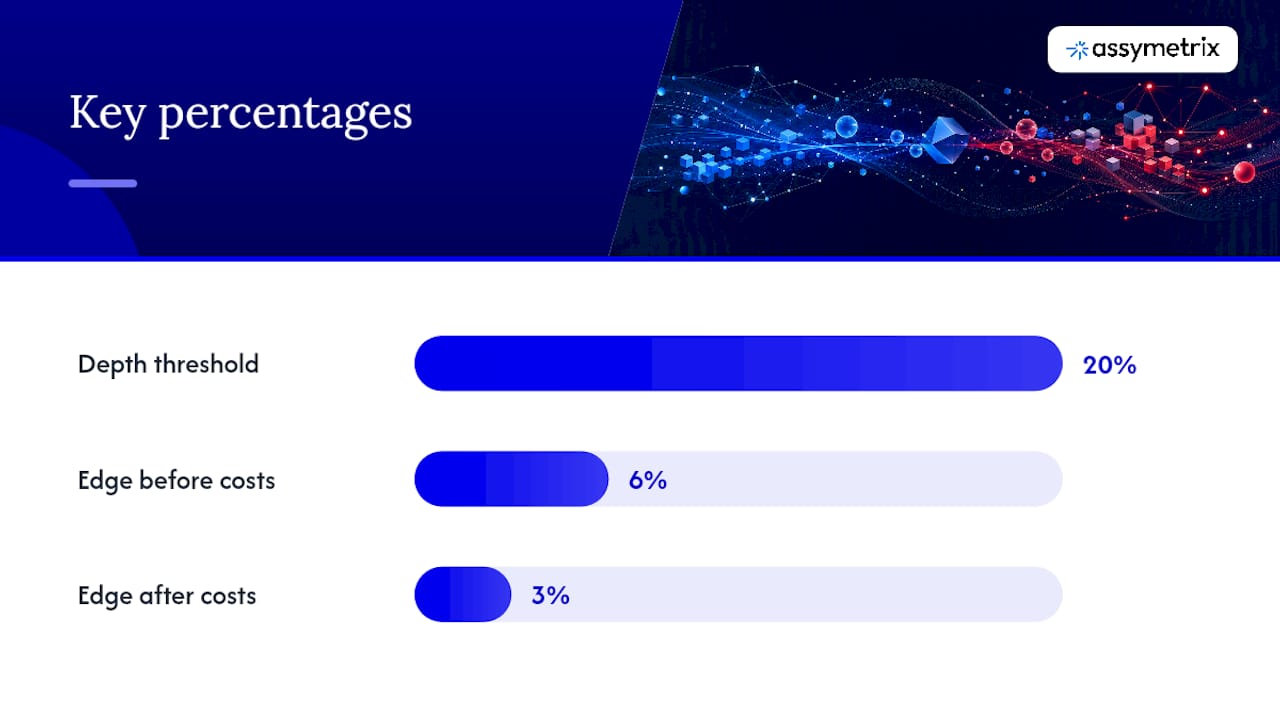
None of this matters if you don’t fold the result back into position sizing. One documented example is instructive: if slippage and round-trip costs cut your measured edge from 6% to 3%, the optimal Kelly stake shrinks by roughly half, because Kelly sizing scales directly with edge. Before comparing model output to market price at all, benchmark against a no-vig fair price using a multiplicative, Shin, or power method, then subtract your estimated slippage from that edge, not from the raw quoted price. Skipping this step is how a theoretically profitable model turns into a losing execution strategy in practice.
Practical Execution Tactics to Limit Slippage
The single most direct lever against slippage is order type. Limit orders cap your worst acceptable fill price, and on venues offering maker incentives, resting a limit order can actually earn a rebate instead of paying to take liquidity. The trade-off is real: a limit order that’s too aggressive on price simply won’t fill, and in a fast-moving market that means missing the trade entirely.
Order slicing addresses the same problem from a different angle by breaking a large order into smaller pieces to reduce instantaneous market impact:
Size-by-tier slicing caps each slice at the volume available on a single book level, so no individual slice pushes through more than one price tier.
Time-slicing spreads execution across a fixed window, reducing the odds that one slice depletes depth right before the next arrives.
Adaptive VWAP-style slicing adjusts slice size dynamically based on observed fill rates and remaining time, trading some execution speed for a materially lower average slippage cost across the full order.
Slicing isn’t free. It adds operational complexity, multiple round trips instead of one, and exposure to price drift between slices if the market is trending against you. Setting an explicit slippage tolerance, a maximum acceptable deviation from your reference price, gives you a mechanical way to abort or requote instead of chasing a fill that’s moved beyond your model’s edge.
For bots and automated systems specifically, latency is its own slippage source. The gap between snapshot time and order-arrival time at the matching engine is where stale depth data turns a clean calculation into a bad fill. Track fill-rate percentage, realized versus estimated slippage, and time-to-fill as ongoing operational metrics, and treat any consistent divergence between estimated and realized slippage as a signal that your depth data or latency assumptions need recalibrating. Third-party guidance on market versus limit order trade-offs and on reducing execution delay in automated systems covers the same principles in more general trading contexts and is worth cross-referencing when you’re designing the execution layer of a bot.
Building a Pre-Trade Slippage Estimator With the Assymetrix Data API
A production slippage estimator needs a consistent pipeline: pull a depth snapshot, simulate cumulative volume consumption, and output an expected fill price before the order routes. The Assymetrix Prediction Market Data API supplies the raw material for that pipeline across Polymarket, Kalshi, and Limitless from a single integration.
The fields that matter for this use case:
Price-tier depth snapshots with volume at each level, refreshed at intervals tight enough to catch pre-resolution liquidity shifts
Historical order-book data for backtesting slippage curves against realized fills
Canonical market IDs that let you compare depth for economically equivalent markets across venues without manually reconciling schema differences, which matters directly for cross-venue price impact analysis
Market metadata including time-to-resolution, useful for flagging markets entering the expiry-driven liquidity collapse window described earlier
Feed those fields through the snapshot-to-cumulative-volume pipeline outlined above, and the estimator can output a full slippage curve across order sizes, the percentage of visible depth your intended size would consume, an EV-adjusted price net of estimated slippage, and threshold alerts when a market’s depth falls below your minimum viable size. Developers building this from scratch can start with the orderbook data integration guide or the Polymarket-specific parsing reference for venue-level field mapping.
A Practitioner’s Pre-Deploy Checklist
Before any execution-aware strategy goes live, run the depth-consumption test at your actual order size, not a token amount, and sanity check the resulting slippage curve against recent history for that market. Verify the round-trip EV, entry slippage plus exit slippage plus fees, still clears your minimum edge threshold, and confirm your latency budget matches the time between snapshot and fill.
The most common mistake is using the displayed mid-price as if it were the fill price. It never is once your size exceeds a thin top-of-book quote. The second is ignoring the expiry liquidity collapse and assuming a market that traded fine last week will trade the same way three hours before resolution. Backtest against historical snapshots first, then validate with small live experiments before scaling size.
— Dean
Get Live Depth Data for Slippage Modeling
Building an execution-aware strategy without live order-book depth is like sizing positions on last week’s quotes. There are data API providers offering unified real-time and historical order-book depth from multiple prediction market venues, with normalized schemas and canonical IDs to enable slippage-modeling pipelines that work across venues without rewriting parsing logic.

Getting started means requesting API access, pulling a depth snapshot for a market you’re already trading, and running it through the cumulative-fill calculation covered above. Developers working in Python can follow the sample pipeline in the Python integration guide to get a working estimator running against real depth data quickly. For Polymarket-specific integration details, the Polymarket resources page covers field-level parsing. Start with the Data API documentation to get an API key and begin pulling live and historical depth for pre-trade slippage estimation.
Sources
Slippage in Prediction Markets: What It Means and How to Minimize it
Prediction Market Liquidity: How Depth, Spread, and Slippage Affect Every Trade | Market Math
No-vig price — vig-stripped fair odds & three calculation methods | OddsCipher Codex
FAQ
Is high slippage always bad?
High slippage isn’t inherently good or bad, it’s a cost that has to be measured against edge. A trade with 5% slippage can still be worth taking if your model’s edge over the no-vig fair price exceeds that cost; the same slippage kills a thin-edge trade.
What is the 3-5-7 rule in trading, and does it apply to prediction markets?
The 3-5-7 rule is a general risk-management guideline from broader trading contexts, capping risk per trade around 3% and total exposure around 5%. It isn’t a prediction-market-specific standard, so treat it as a rough risk-sizing reference rather than a rule tailored to slippage or order-book dynamics.
How much slippage should I expect on a prediction market trade?
It depends entirely on order size relative to visible depth. Orders under roughly 20% of visible book depth typically see minimal slippage, while larger orders on thin or near-expiry markets can see slippage of several cents per contract, which is why running a depth simulation before trading matters more than applying a fixed rule of thumb.
How do I avoid slippage when trading prediction markets?
Use limit orders to cap your worst acceptable fill price, slice large orders into smaller pieces sized to available depth, and avoid trading heavily concentrated positions in the liquidity vacuum that often appears right before resolution. Pulling live order-book depth through an API like Assymetrix before you trade lets you estimate slippage and adjust size ahead of execution rather than after a bad fill.
Assymetrix: Estimate Slippage in Prediction Markets for Devs & Quants
Slippage in prediction markets is the gap between the displayed price and your average executed price once an order consumes real order-book depth. It ties directly to implied probability, so every basis point of slippage is a direct subtraction from model edge. This guide walks through the mechanics, the math, and a live-data workflow for estimating slippage before you place an order.
TL;DR:
Slippage increases significantly when trading more than 20% of the available order-book depth, especially in thin or near-expiry markets.
Larger orders can cause slippage of several cents per contract, which may substantially reduce your model’s implied edge.
Market timing, order slicing, and limit orders help mitigate slippage, but they add operational complexity and execution risk.
Accurate pre-trade slippage estimation requires real-time order-book snapshots and simulation of order consumption to adjust position size accordingly.
Using automated APIs for live and historical depth data enables better modeling of slippage risks across prediction market venues.
AssymetrixModel Slippage With Unified Market DataAssymetrix brings real-time and historical prediction market data across Polymarket, Kalshi, and Limitless into one intelligence layer.Explore Assymetrix
Table of Contents
What Slippage Means in Prediction Markets
Why Slippage Behaves Differently in Prediction Markets
Measuring and Modeling Slippage from Order-Book Depth
Practical Execution Tactics to Limit Slippage
Building a Pre-Trade Slippage Estimator With the Assymetrix Data API
A Practitioner’s Pre-Deploy Checklist
Get Live Depth Data for Slippage Modeling
Sources
What Slippage Means in Prediction Markets
Slippage is the difference between the price quoted at the top of the book and the average price you actually pay once your order fills across multiple levels of depth. In a market pricing a binary event, that top-of-book quote functions as an implied probability, so slippage doesn’t just cost you money, it drags your entry price away from the probability your model actually estimated. A sourced explainer on prediction market slippage frames it plainly: the cause is a mix of thin liquidity, oversized orders relative to that liquidity, and the mechanics of whatever execution model the venue runs.
Here’s a worked example. Suppose a market shows a best offer of 42 cents for “Yes,” and you want to buy a large number of contracts. The book might look like this:
800 contracts available at 42 cents
1,400 contracts available at 43 cents
1,800 contracts available at 44 cents
1,000 contracts available at 45 cents (the remainder needed to fill 5,000)
Your average fill price becomes the volume-weighted average price across those tiers, resulting in a small slippage amount per contract against the quoted 42 cents, equating to a meaningful total cost on the full order. If your model’s fair value was 44 cents, your real edge just shrank from 2 cents to 0.56 cents before you’ve paid a single explicit fee.
Slippage is distinct from both the bid-ask spread and platform fees, though all three erode the same edge. Spread is the static gap between best bid and best offer, visible before you trade. Fees are contractual and usually fixed. Slippage is dynamic. It scales with your order size relative to the depth sitting in front of it, which means the same market can be cheap to trade at 100 contracts and expensive at 5,000.
Why Slippage Behaves Differently in Prediction Markets
Prediction markets price everything between 0 and 100 (or 0 and 1), and that bound changes how slippage functions compared to unbounded asset markets. A 2 cent move on a stock trading at $150 is trivial. A 2 cent move on a contract priced at 8 cents is a 25% relative price change, and it’s an even larger swing in implied probability terms near the extremes, where the market is most sensitive to new information.
Several forces make this worse in practice, and they compound rather than operate in isolation:
Bounded pricing amplifies percentage cost. The closer a contract trades to 0 or 100, the more a fixed-cent slippage amount distorts the percentage cost and the underlying probability estimate.
Liquidity concentrates and then evaporates near expiry. Niche or long-tail markets often carry thin books for most of their life, then see a burst of activity as resolution nears, followed by liquidity that can disappear entirely once the outcome becomes near-certain.
Execution model shapes the slippage curve. A comparison of CLOB and AMM mechanics notes that central limit order books force large orders to “walk the book” through discrete price tiers, while automated market makers push price along a continuous curve, often producing steeper price impact per unit size for a given amount of liquidity.
Volatility spikes around news events compress your reaction window. A breaking headline can move a market several cents in seconds, turning a previously calm order-book snapshot stale before your order routes.
The practical consequence is that slippage modeling in prediction markets can’t borrow wholesale from equities or futures playbooks. A model that treats liquidity as roughly constant will systematically underprice execution risk in markets where depth is a function of time-to-resolution, not just trading volume. Any pre-trade estimate has to account for where a market sits on its own liquidity lifecycle, not just its current book snapshot.
Measuring and Modeling Slippage from Order-Book Depth
Modeling slippage starts with treating the order book as a queue of price tiers, each with a finite volume, and simulating how your order consumes them in sequence. This is the same cumulative-depth approach used in the worked example above, just generalized into a repeatable calculation you can run before every trade.
What you need from a depth snapshot. At minimum: price level, volume available at that level, and a timestamp close enough to execution time that the snapshot hasn’t gone stale. A practical liquidity calculator methodology recommends running this check whenever your intended order size exceeds roughly 20% of visible depth, since below that threshold slippage tends to be negligible on most active markets.
The deterministic formula for expected average fill price is straightforward:
Sort book levels by price in the direction of your trade (ascending for buys, descending for sells).
Walk down the levels, accumulating volume until you reach your target order size, splitting the final level if it only partially fills your order.
Compute average fill price as the volume-weighted mean across all consumed levels:
sum(price_i * volume_i) / total_order_size.Subtract the top-of-book price from that average to get slippage per contract, then multiply by order size for total dollar slippage.
Pro Tip: Run this calculation against live snapshots, not delayed ones. A book that looked deep three seconds ago can thin out fast once a large order or a news-driven wave of activity hits it, especially in the hours before resolution.
For markets where you don’t have full depth granularity, a parametric price-impact approximation can substitute, modeling expected slippage as a function proportional to order size divided by available depth, calibrated against historical fills. This is faster to compute at scale but less precise than a direct book simulation, so it works best as a screening tool to flag markets worth a full depth check rather than a final execution decision.
Monte Carlo simulation adds a layer that a static snapshot can’t: fill uncertainty from latency and order-arrival risk. Between the moment you pull a depth snapshot and the moment your order actually reaches the matching engine, other participants may have consumed some of that depth. Running repeated draws over plausible depth-depletion scenarios, informed by historical fill data, gives you a distribution of likely average fill prices rather than a single point estimate, which matters more the longer your execution latency runs.
None of this matters if you don’t fold the result back into position sizing. One documented example is instructive: if slippage and round-trip costs cut your measured edge from 6% to 3%, the optimal Kelly stake shrinks by roughly half, because Kelly sizing scales directly with edge. Before comparing model output to market price at all, benchmark against a no-vig fair price using a multiplicative, Shin, or power method, then subtract your estimated slippage from that edge, not from the raw quoted price. Skipping this step is how a theoretically profitable model turns into a losing execution strategy in practice.
Practical Execution Tactics to Limit Slippage
The single most direct lever against slippage is order type. Limit orders cap your worst acceptable fill price, and on venues offering maker incentives, resting a limit order can actually earn a rebate instead of paying to take liquidity. The trade-off is real: a limit order that’s too aggressive on price simply won’t fill, and in a fast-moving market that means missing the trade entirely.
Order slicing addresses the same problem from a different angle by breaking a large order into smaller pieces to reduce instantaneous market impact:
Size-by-tier slicing caps each slice at the volume available on a single book level, so no individual slice pushes through more than one price tier.
Time-slicing spreads execution across a fixed window, reducing the odds that one slice depletes depth right before the next arrives.
Adaptive VWAP-style slicing adjusts slice size dynamically based on observed fill rates and remaining time, trading some execution speed for a materially lower average slippage cost across the full order.
Slicing isn’t free. It adds operational complexity, multiple round trips instead of one, and exposure to price drift between slices if the market is trending against you. Setting an explicit slippage tolerance, a maximum acceptable deviation from your reference price, gives you a mechanical way to abort or requote instead of chasing a fill that’s moved beyond your model’s edge.
For bots and automated systems specifically, latency is its own slippage source. The gap between snapshot time and order-arrival time at the matching engine is where stale depth data turns a clean calculation into a bad fill. Track fill-rate percentage, realized versus estimated slippage, and time-to-fill as ongoing operational metrics, and treat any consistent divergence between estimated and realized slippage as a signal that your depth data or latency assumptions need recalibrating. Third-party guidance on market versus limit order trade-offs and on reducing execution delay in automated systems covers the same principles in more general trading contexts and is worth cross-referencing when you’re designing the execution layer of a bot.
Building a Pre-Trade Slippage Estimator With the Assymetrix Data API
A production slippage estimator needs a consistent pipeline: pull a depth snapshot, simulate cumulative volume consumption, and output an expected fill price before the order routes. The Assymetrix Prediction Market Data API supplies the raw material for that pipeline across Polymarket, Kalshi, and Limitless from a single integration.
The fields that matter for this use case:
Price-tier depth snapshots with volume at each level, refreshed at intervals tight enough to catch pre-resolution liquidity shifts
Historical order-book data for backtesting slippage curves against realized fills
Canonical market IDs that let you compare depth for economically equivalent markets across venues without manually reconciling schema differences, which matters directly for cross-venue price impact analysis
Market metadata including time-to-resolution, useful for flagging markets entering the expiry-driven liquidity collapse window described earlier
Feed those fields through the snapshot-to-cumulative-volume pipeline outlined above, and the estimator can output a full slippage curve across order sizes, the percentage of visible depth your intended size would consume, an EV-adjusted price net of estimated slippage, and threshold alerts when a market’s depth falls below your minimum viable size. Developers building this from scratch can start with the orderbook data integration guide or the Polymarket-specific parsing reference for venue-level field mapping.
A Practitioner’s Pre-Deploy Checklist
Before any execution-aware strategy goes live, run the depth-consumption test at your actual order size, not a token amount, and sanity check the resulting slippage curve against recent history for that market. Verify the round-trip EV, entry slippage plus exit slippage plus fees, still clears your minimum edge threshold, and confirm your latency budget matches the time between snapshot and fill.
The most common mistake is using the displayed mid-price as if it were the fill price. It never is once your size exceeds a thin top-of-book quote. The second is ignoring the expiry liquidity collapse and assuming a market that traded fine last week will trade the same way three hours before resolution. Backtest against historical snapshots first, then validate with small live experiments before scaling size.
— Dean
Get Live Depth Data for Slippage Modeling
Building an execution-aware strategy without live order-book depth is like sizing positions on last week’s quotes. There are data API providers offering unified real-time and historical order-book depth from multiple prediction market venues, with normalized schemas and canonical IDs to enable slippage-modeling pipelines that work across venues without rewriting parsing logic.
Getting started means requesting API access, pulling a depth snapshot for a market you’re already trading, and running it through the cumulative-fill calculation covered above. Developers working in Python can follow the sample pipeline in the Python integration guide to get a working estimator running against real depth data quickly. For Polymarket-specific integration details, the Polymarket resources page covers field-level parsing. Start with the Data API documentation to get an API key and begin pulling live and historical depth for pre-trade slippage estimation.
Sources
Slippage in Prediction Markets: What It Means and How to Minimize it
Prediction Market Liquidity: How Depth, Spread, and Slippage Affect Every Trade | Market Math
No-vig price — vig-stripped fair odds & three calculation methods | OddsCipher Codex
FAQ
Is high slippage always bad?
High slippage isn’t inherently good or bad, it’s a cost that has to be measured against edge. A trade with 5% slippage can still be worth taking if your model’s edge over the no-vig fair price exceeds that cost; the same slippage kills a thin-edge trade.
What is the 3-5-7 rule in trading, and does it apply to prediction markets?
The 3-5-7 rule is a general risk-management guideline from broader trading contexts, capping risk per trade around 3% and total exposure around 5%. It isn’t a prediction-market-specific standard, so treat it as a rough risk-sizing reference rather than a rule tailored to slippage or order-book dynamics.
How much slippage should I expect on a prediction market trade?
It depends entirely on order size relative to visible depth. Orders under roughly 20% of visible book depth typically see minimal slippage, while larger orders on thin or near-expiry markets can see slippage of several cents per contract, which is why running a depth simulation before trading matters more than applying a fixed rule of thumb.
How do I avoid slippage when trading prediction markets?
Use limit orders to cap your worst acceptable fill price, slice large orders into smaller pieces sized to available depth, and avoid trading heavily concentrated positions in the liquidity vacuum that often appears right before resolution. Pulling live order-book depth through an API like Assymetrix before you trade lets you estimate slippage and adjust size ahead of execution rather than after a bad fill.
Other Blog


