Sports Prediction Market Data: A Developer's Guide
Sports Prediction Market Data: A Developer's Guide
Sports Prediction Market Data: A Developer's Guide
How to source, normalize and use sports prediction market data across Kalshi, Polymarket and Limitless: schemas, liquidity, spreads, arbitrage and tax records.

Sports Prediction Market Data: A Developer’s Guide
Sports prediction market data is the stream of prices, order books, trades and settlements from venues that list contracts on games, seasons and player props. The hard part is not getting it. Each venue publishes some of it. The hard part is making three differently shaped feeds answer one question: what is the market-implied probability of this outcome, how deep is it, and who is moving it? This guide covers what the data contains, where it breaks, and how to build a pipeline you can trust for research, bots and agents.
Assymetrixdata.assymetrix.comBuild With Unified Market DataAccess structured prediction market data across Polymarket, Kalshi, and Limitless through Assymetrix’s Data API and a single integration.Explore the Data API
TL;DR
Sports now drive a large share of prediction market activity, so sports data is where schema, liquidity and latency problems show up first.
The same game appears under different identifiers, rules and settlement terms on each venue. Canonical IDs and normalized outcomes come before any signal work.
A quoted price is not an executable price. Store the order book and spread, not only the last trade.
Market makers sit on the other side of much sports flow, so wallet-level and order-flow data matter more than headline probabilities.
Keep itemized trade records from day one. Tax treatment of these contracts is unsettled.
Table of Contents
Why sports became the main prediction market dataset
What sports prediction market data actually contains
The three problems every sports pipeline hits
Building the pipeline
Liquidity and order book data
Who is on the other side: market makers and Smart Money
Cross-venue arbitrage on sports contracts
Backtesting without fooling yourself
Feeding sports data to AI agents
Our perspective: neutrality is a data property
Keep records: the tax side of trading sports contracts
Where to start with Assymetrix
Sources
Why sports became the main prediction market dataset
Sports is the category with the most contracts, the most repeat events and the fastest resolution. That makes it the richest dataset for anyone studying calibration, microstructure or strategy.
The scale is documented. A Pew Research Center analysis of data from The Block found combined monthly global volume on the two largest venues rose from under $5 billion in September 2025 to about $24 billion in April 2026. The same analysis puts sports at 80% of Kalshi’s trading volume and 39% of Polymarket’s since July 2024. If you build for prediction markets, you are mostly building for sports.
That concentration has two consequences for data work:
Sports contracts have hard, scheduled resolution. Every game produces a clean label for backtests.
Volume spikes around kickoff, injuries and in-game swings. Any pipeline that works on a quiet Tuesday and fails on a Sunday slate is not production-ready.
What sports prediction market data actually contains
A useful dataset has more layers than a price chart. Think in five tables.
Layer | What it holds | Why it matters |
|---|---|---|
Market metadata | Event, teams, contract wording, close and settlement times, resolution source | Lets you match the same game across venues |
Price snapshots | Mid, best bid, best ask at fixed intervals | Backtesting and charting |
Order book depth | Resting size at each price level | Estimating what a real order would cost |
Trades | Timestamp, price, size, side, and where available the wallet | Order flow and Smart Money analysis |
Settlements | Final outcome, payout, any voided or disputed status | Labels for calibration and skill scoring |
Most tutorials stop at the second row. The third and fourth are where edge, and cost, live.
Moneyline, spread, total and prop contracts
Sports contracts come in several shapes: winner, point spread, game total and player or team props. Each has its own threshold semantics. A “Team A wins” contract is binary. A spread contract is binary on a threshold, and different venues choose different threshold grids. Store the threshold as a numeric field instead of burying it in a title string, or you will end up regex-parsing contract names forever.
The three problems every sports pipeline hits
1. Identity: one game, three identifiers
Kalshi, Polymarket and Limitless each assign their own market and event identifiers, and they name teams and games differently. Before you compare a price, you have to decide that two contracts describe the same real-world outcome. That means mapping venue IDs to a canonical event, mapping each outcome to a canonical side, and recording differences in rules such as overtime handling, postponements and void conditions.
Get this wrong and your arbitrage signal is actually two different bets. We cover the approach in our guide to shipping sports prediction market pipelines with canonical IDs.
2. Price semantics: probability, quote or execution
A displayed price of 62 cents reads as a 62% probability, but three different numbers hide behind it: the last trade, the midpoint, and the price you would actually get for your size. They diverge most when you most want accuracy, in thin pre-game markets and in the seconds after a score.
The cost is the spread. The mechanics are the same ones that govern any listed instrument, and a primer on bid-ask spreads and liquidity measurement explains why a wide spread acts as a recurring tax on every round trip. In a binary contract that trades between 0 and 1, a two-cent spread is a large share of your expected edge.
3. Time: the clock in a live game
In-game contracts reprice as the game state changes. For research, you need event timestamps from the venue and your own receive timestamps, kept separate. For live bots, you need to know whether the price you see is stale relative to the play that just happened. Store both clocks and measure the gap.
Building the pipeline
A workable sports data pipeline has five stages. Here is the order we would build them in.
Ingest raw. Pull from each venue’s REST endpoints for discovery and history and from WebSockets for live updates. Persist the raw payloads untouched, so you can re-parse when a schema changes.
Normalize. Convert every venue’s fields to one schema: canonical event ID, canonical outcome, price as a decimal probability, size in contracts and in dollars, UTC timestamps.
Reconcile. Match events across venues and flag rule differences. Anything you cannot match with confidence is excluded from cross-venue signals, not guessed.
Enrich. Add liquidity measures, order flow features and wallet attributes where the venue exposes them.
Serve. Expose the result through one interface to your notebooks, bots and agents, with the same field names for live and historical data.
Steps 1 to 3 are undifferentiated work that every team repeats. Our write-ups on the real-time and historical data feed and Python access to prediction market data show what the finished layer looks like from the consumer side.
A minimal normalized record
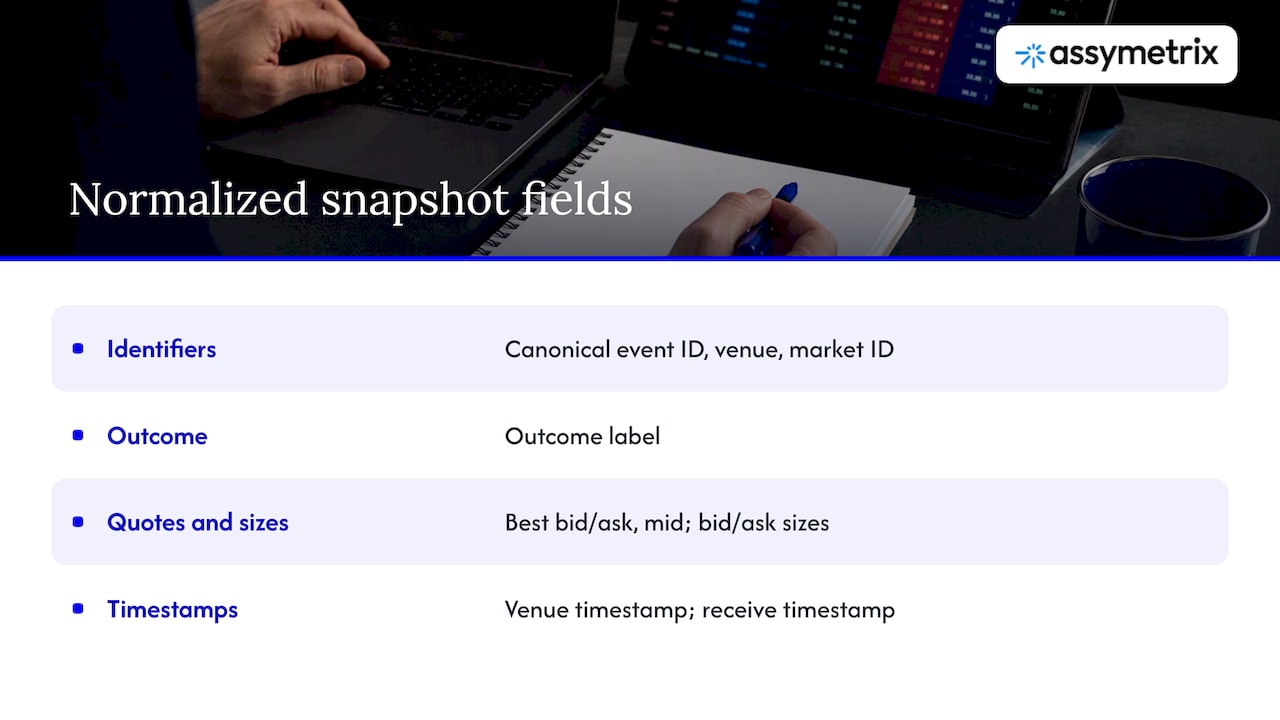
Whatever you build, aim for a row like this for every snapshot: canonical event ID, venue, venue market ID, outcome label, best bid, best ask, mid, bid size, ask size, venue timestamp, receive timestamp. If your record cannot answer “what could I have bought, and how much” it is a chart feed, not a trading dataset.
Liquidity and order book data
Sports markets look liquid on the headline and thin one level down. Depth near the touch is what decides whether a signal is tradable.
Useful measures to compute from order book snapshots:
Quoted spread at the best bid and ask, in cents.
Depth within N cents of the mid, per side.
Slippage curve: the average price you would pay for 100, 1,000 and 10,000 dollars of contracts.
Book imbalance: bid depth against ask depth, as a short-horizon pressure indicator.
Our guides on prediction market liquidity metrics and order book data for developers go through these in more detail. For the microstructure behind them, see what the data reveals about prediction market microstructure.
Who is on the other side: market makers and Smart Money
Prediction markets are often described as peer to peer. Reporting on the sports side of the industry points to a more nuanced picture: Sportico’s explainer on sports prediction markets discusses the role of institutional market makers such as Susquehanna International Group in providing liquidity. For a quant, the implication is practical. A strategy that assumes the price is an unbiased crowd consensus will systematically misread it, because part of the spread is the cost of dealing with professional liquidity providers.
This is why order flow and wallet-level data deserve attention. On venues where trades are tied to wallets, you can separate persistent, profitable participants from noise and track what they do before a line moves. Two ideas follow:
Smart Money tracking: identify wallets with durable, risk-adjusted records and monitor their entries and exits.
Trader skill scoring: rank participants by realized performance on settled markets, adjusting for the number of bets and the odds taken, so that one lucky parlay does not look like skill.
Both need complete trade and settlement history. Start with our order flow analysis guide and the Smart Money alerts overview.
Cross-venue arbitrage on sports contracts
When two venues price the same outcome differently, a gap exists. Whether it is an opportunity depends on four things:
The contracts really are equivalent (the identity problem above).
Both sides have enough depth at the quoted price for your size.
Fees and withdrawal or settlement frictions do not eat the gap.
Settlement rules are the same in edge cases such as postponed games.
Most visible gaps fail one of these tests. A 4-cent gap on a thin book that disappears at 200 dollars is a display artifact. The disciplined approach is to compute the gap on executable prices at your target size, log every candidate whether you trade it or not, and then measure how long gaps persist. Our arbitrage strategy guide walks through that process, and the cross-venue signal generation guide covers divergence signals that are not strict arbitrage.
Backtesting without fooling yourself
Sports data tempts you into overfitting because there are so many games and so many features. A few guardrails:
Use executable prices. Backtest at the ask when buying and the bid when selling, not at the mid.
Respect the information clock. Features must be available at the time of the simulated trade, using your receive timestamps, not the venue’s.
Split by time, not at random. Train on earlier seasons or weeks and test on later ones.
Count your trials. If you tried 200 filters, a good result on one of them is expected by chance.
Model fills. If your size exceeds top-of-book depth, simulate walking the book.
Our post on backtesting prediction market strategies with price snapshots shows this workflow on real snapshot data. If your question is about forecast quality rather than trading, the prediction market accuracy data guide covers calibration.
Feeding sports data to AI agents
Agents have different needs from dashboards. They need typed, consistent fields, explicit units and a clear statement of what is and is not known. Give an agent probabilities as decimals, sizes in dollars, and a staleness flag. Give it depth along with price, and have it justify any order against that depth. Do not let an agent infer that two contracts are the same game from their titles; hand it the canonical ID. We describe patterns for this in how AI agents use prediction market data to trade autonomously and the broader AI agents developer guide.
Our perspective: neutrality is a data property
We built Assymetrix because the useful question in sports markets is rarely “what does one venue say.” It is “what do the venues say together, and who is trading.” A feed tied to a single exchange cannot answer that, and a feed that merely concatenates three schemas pushes the hardest work onto you.
Our position is that a prediction market data layer should be venue-neutral, normalized once, and deep enough to include on-chain trade history, because wallet behavior is where sports markets leak information. Our archive spans roughly 1.5 terabytes and nearly one billion rows of trading activity across Polymarket, Kalshi and Limitless, and we think that history matters more than any single model built on top of it.
We also think probability displays deserve skepticism. A price is a negotiated number between participants with different costs and information. Treat it as evidence, not truth, and size your conviction to the depth behind it.
— Dean
Keep records: the tax side of trading sports contracts
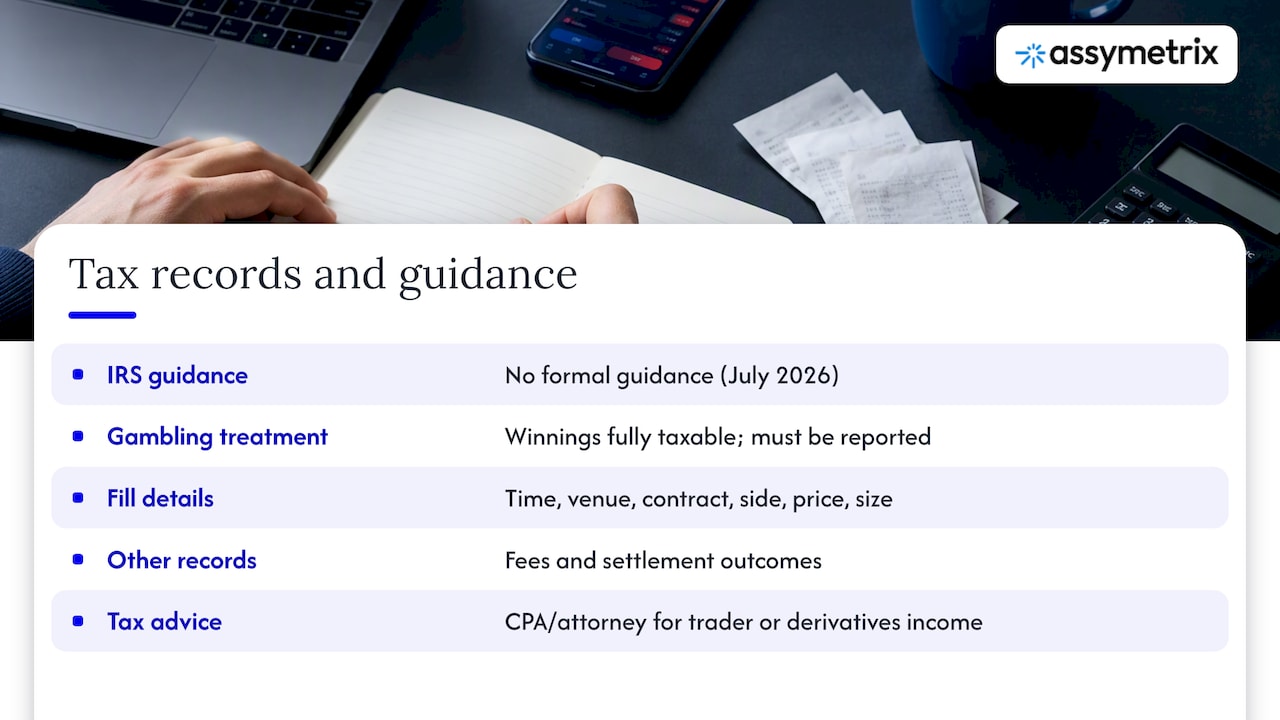
If you trade these contracts, your data pipeline doubles as your tax file. As of CNBC’s July 2026 reporting, the IRS had not issued formal guidance on how prediction market wins and losses should be taxed, and platforms report inconsistently. The same article notes that if income were treated as gambling, the rules would differ from capital gains treatment. For reference, the IRS states that gambling winnings are fully taxable and must be reported.
Practically, export and archive every fill with timestamp, venue, contract, side, price, size and fees, along with settlement outcomes. Then take the records to a CPA or tax attorney who handles trader or derivatives income, because the right treatment for your situation depends on facts we cannot assess here.
Where to start with Assymetrix
If you would rather not rebuild three feeds, our Data API gives developers, quants and agents one integration for real-time and historical data across Polymarket, Kalshi and Limitless. For a look at the signals built on top of it, see cross-venue intelligence, or start at assymetrix.com.
FAQ
Where can I get historical sports prediction market data?
Each venue publishes some history through its own API, but formats, depth and retention differ. A unified provider normalizes them into one schema so you can query several venues in one request. Check that any source includes order book snapshots and settlements, not only prices.
Is a prediction market price the true probability of a team winning?
Not exactly. The price reflects supply, demand, fees and the spread set by liquidity providers. It is a useful estimate, but it can sit slightly above or below the fair probability, especially in thin markets. Use the midpoint and depth together, and test calibration on settled markets.
Can I find the same game on Kalshi, Polymarket and Limitless?
Often, but the contracts are not always identical. Wording, thresholds and rules for postponements or overtime can differ. Map each market to a canonical event and compare resolution terms before treating any price gap as arbitrage.
Do I need wallet-level data for sports markets?
You do not need it to chart prices, but you do for Smart Money tracking and skill scoring. It is available on venues where trades are recorded on-chain. It lets you separate consistent performers from noise.
How should I keep records for taxes?
Save every fill and settlement with timestamps, prices, sizes and fees. IRS guidance on these contracts was still absent as of mid-2026, so itemized records protect you under any classification. A tax professional can advise on reporting.
Sources
Sports Prediction Market Data: A Developer’s Guide
Sports prediction market data is the stream of prices, order books, trades and settlements from venues that list contracts on games, seasons and player props. The hard part is not getting it. Each venue publishes some of it. The hard part is making three differently shaped feeds answer one question: what is the market-implied probability of this outcome, how deep is it, and who is moving it? This guide covers what the data contains, where it breaks, and how to build a pipeline you can trust for research, bots and agents.
Assymetrixdata.assymetrix.comBuild With Unified Market DataAccess structured prediction market data across Polymarket, Kalshi, and Limitless through Assymetrix’s Data API and a single integration.Explore the Data API
TL;DR
Sports now drive a large share of prediction market activity, so sports data is where schema, liquidity and latency problems show up first.
The same game appears under different identifiers, rules and settlement terms on each venue. Canonical IDs and normalized outcomes come before any signal work.
A quoted price is not an executable price. Store the order book and spread, not only the last trade.
Market makers sit on the other side of much sports flow, so wallet-level and order-flow data matter more than headline probabilities.
Keep itemized trade records from day one. Tax treatment of these contracts is unsettled.
Table of Contents
Why sports became the main prediction market dataset
What sports prediction market data actually contains
The three problems every sports pipeline hits
Building the pipeline
Liquidity and order book data
Who is on the other side: market makers and Smart Money
Cross-venue arbitrage on sports contracts
Backtesting without fooling yourself
Feeding sports data to AI agents
Our perspective: neutrality is a data property
Keep records: the tax side of trading sports contracts
Where to start with Assymetrix
Sources
Why sports became the main prediction market dataset
Sports is the category with the most contracts, the most repeat events and the fastest resolution. That makes it the richest dataset for anyone studying calibration, microstructure or strategy.
The scale is documented. A Pew Research Center analysis of data from The Block found combined monthly global volume on the two largest venues rose from under $5 billion in September 2025 to about $24 billion in April 2026. The same analysis puts sports at 80% of Kalshi’s trading volume and 39% of Polymarket’s since July 2024. If you build for prediction markets, you are mostly building for sports.
That concentration has two consequences for data work:
Sports contracts have hard, scheduled resolution. Every game produces a clean label for backtests.
Volume spikes around kickoff, injuries and in-game swings. Any pipeline that works on a quiet Tuesday and fails on a Sunday slate is not production-ready.
What sports prediction market data actually contains
A useful dataset has more layers than a price chart. Think in five tables.
Layer | What it holds | Why it matters |
|---|---|---|
Market metadata | Event, teams, contract wording, close and settlement times, resolution source | Lets you match the same game across venues |
Price snapshots | Mid, best bid, best ask at fixed intervals | Backtesting and charting |
Order book depth | Resting size at each price level | Estimating what a real order would cost |
Trades | Timestamp, price, size, side, and where available the wallet | Order flow and Smart Money analysis |
Settlements | Final outcome, payout, any voided or disputed status | Labels for calibration and skill scoring |
Most tutorials stop at the second row. The third and fourth are where edge, and cost, live.
Moneyline, spread, total and prop contracts
Sports contracts come in several shapes: winner, point spread, game total and player or team props. Each has its own threshold semantics. A “Team A wins” contract is binary. A spread contract is binary on a threshold, and different venues choose different threshold grids. Store the threshold as a numeric field instead of burying it in a title string, or you will end up regex-parsing contract names forever.
The three problems every sports pipeline hits
1. Identity: one game, three identifiers
Kalshi, Polymarket and Limitless each assign their own market and event identifiers, and they name teams and games differently. Before you compare a price, you have to decide that two contracts describe the same real-world outcome. That means mapping venue IDs to a canonical event, mapping each outcome to a canonical side, and recording differences in rules such as overtime handling, postponements and void conditions.
Get this wrong and your arbitrage signal is actually two different bets. We cover the approach in our guide to shipping sports prediction market pipelines with canonical IDs.
2. Price semantics: probability, quote or execution
A displayed price of 62 cents reads as a 62% probability, but three different numbers hide behind it: the last trade, the midpoint, and the price you would actually get for your size. They diverge most when you most want accuracy, in thin pre-game markets and in the seconds after a score.
The cost is the spread. The mechanics are the same ones that govern any listed instrument, and a primer on bid-ask spreads and liquidity measurement explains why a wide spread acts as a recurring tax on every round trip. In a binary contract that trades between 0 and 1, a two-cent spread is a large share of your expected edge.
3. Time: the clock in a live game
In-game contracts reprice as the game state changes. For research, you need event timestamps from the venue and your own receive timestamps, kept separate. For live bots, you need to know whether the price you see is stale relative to the play that just happened. Store both clocks and measure the gap.
Building the pipeline
A workable sports data pipeline has five stages. Here is the order we would build them in.
Ingest raw. Pull from each venue’s REST endpoints for discovery and history and from WebSockets for live updates. Persist the raw payloads untouched, so you can re-parse when a schema changes.
Normalize. Convert every venue’s fields to one schema: canonical event ID, canonical outcome, price as a decimal probability, size in contracts and in dollars, UTC timestamps.
Reconcile. Match events across venues and flag rule differences. Anything you cannot match with confidence is excluded from cross-venue signals, not guessed.
Enrich. Add liquidity measures, order flow features and wallet attributes where the venue exposes them.
Serve. Expose the result through one interface to your notebooks, bots and agents, with the same field names for live and historical data.
Steps 1 to 3 are undifferentiated work that every team repeats. Our write-ups on the real-time and historical data feed and Python access to prediction market data show what the finished layer looks like from the consumer side.
A minimal normalized record
Whatever you build, aim for a row like this for every snapshot: canonical event ID, venue, venue market ID, outcome label, best bid, best ask, mid, bid size, ask size, venue timestamp, receive timestamp. If your record cannot answer “what could I have bought, and how much” it is a chart feed, not a trading dataset.
Liquidity and order book data
Sports markets look liquid on the headline and thin one level down. Depth near the touch is what decides whether a signal is tradable.
Useful measures to compute from order book snapshots:
Quoted spread at the best bid and ask, in cents.
Depth within N cents of the mid, per side.
Slippage curve: the average price you would pay for 100, 1,000 and 10,000 dollars of contracts.
Book imbalance: bid depth against ask depth, as a short-horizon pressure indicator.
Our guides on prediction market liquidity metrics and order book data for developers go through these in more detail. For the microstructure behind them, see what the data reveals about prediction market microstructure.
Who is on the other side: market makers and Smart Money
Prediction markets are often described as peer to peer. Reporting on the sports side of the industry points to a more nuanced picture: Sportico’s explainer on sports prediction markets discusses the role of institutional market makers such as Susquehanna International Group in providing liquidity. For a quant, the implication is practical. A strategy that assumes the price is an unbiased crowd consensus will systematically misread it, because part of the spread is the cost of dealing with professional liquidity providers.
This is why order flow and wallet-level data deserve attention. On venues where trades are tied to wallets, you can separate persistent, profitable participants from noise and track what they do before a line moves. Two ideas follow:
Smart Money tracking: identify wallets with durable, risk-adjusted records and monitor their entries and exits.
Trader skill scoring: rank participants by realized performance on settled markets, adjusting for the number of bets and the odds taken, so that one lucky parlay does not look like skill.
Both need complete trade and settlement history. Start with our order flow analysis guide and the Smart Money alerts overview.
Cross-venue arbitrage on sports contracts
When two venues price the same outcome differently, a gap exists. Whether it is an opportunity depends on four things:
The contracts really are equivalent (the identity problem above).
Both sides have enough depth at the quoted price for your size.
Fees and withdrawal or settlement frictions do not eat the gap.
Settlement rules are the same in edge cases such as postponed games.
Most visible gaps fail one of these tests. A 4-cent gap on a thin book that disappears at 200 dollars is a display artifact. The disciplined approach is to compute the gap on executable prices at your target size, log every candidate whether you trade it or not, and then measure how long gaps persist. Our arbitrage strategy guide walks through that process, and the cross-venue signal generation guide covers divergence signals that are not strict arbitrage.
Backtesting without fooling yourself
Sports data tempts you into overfitting because there are so many games and so many features. A few guardrails:
Use executable prices. Backtest at the ask when buying and the bid when selling, not at the mid.
Respect the information clock. Features must be available at the time of the simulated trade, using your receive timestamps, not the venue’s.
Split by time, not at random. Train on earlier seasons or weeks and test on later ones.
Count your trials. If you tried 200 filters, a good result on one of them is expected by chance.
Model fills. If your size exceeds top-of-book depth, simulate walking the book.
Our post on backtesting prediction market strategies with price snapshots shows this workflow on real snapshot data. If your question is about forecast quality rather than trading, the prediction market accuracy data guide covers calibration.
Feeding sports data to AI agents
Agents have different needs from dashboards. They need typed, consistent fields, explicit units and a clear statement of what is and is not known. Give an agent probabilities as decimals, sizes in dollars, and a staleness flag. Give it depth along with price, and have it justify any order against that depth. Do not let an agent infer that two contracts are the same game from their titles; hand it the canonical ID. We describe patterns for this in how AI agents use prediction market data to trade autonomously and the broader AI agents developer guide.
Our perspective: neutrality is a data property
We built Assymetrix because the useful question in sports markets is rarely “what does one venue say.” It is “what do the venues say together, and who is trading.” A feed tied to a single exchange cannot answer that, and a feed that merely concatenates three schemas pushes the hardest work onto you.
Our position is that a prediction market data layer should be venue-neutral, normalized once, and deep enough to include on-chain trade history, because wallet behavior is where sports markets leak information. Our archive spans roughly 1.5 terabytes and nearly one billion rows of trading activity across Polymarket, Kalshi and Limitless, and we think that history matters more than any single model built on top of it.
We also think probability displays deserve skepticism. A price is a negotiated number between participants with different costs and information. Treat it as evidence, not truth, and size your conviction to the depth behind it.
— Dean
Keep records: the tax side of trading sports contracts
If you trade these contracts, your data pipeline doubles as your tax file. As of CNBC’s July 2026 reporting, the IRS had not issued formal guidance on how prediction market wins and losses should be taxed, and platforms report inconsistently. The same article notes that if income were treated as gambling, the rules would differ from capital gains treatment. For reference, the IRS states that gambling winnings are fully taxable and must be reported.
Practically, export and archive every fill with timestamp, venue, contract, side, price, size and fees, along with settlement outcomes. Then take the records to a CPA or tax attorney who handles trader or derivatives income, because the right treatment for your situation depends on facts we cannot assess here.
Where to start with Assymetrix
If you would rather not rebuild three feeds, our Data API gives developers, quants and agents one integration for real-time and historical data across Polymarket, Kalshi and Limitless. For a look at the signals built on top of it, see cross-venue intelligence, or start at assymetrix.com.
FAQ
Where can I get historical sports prediction market data?
Each venue publishes some history through its own API, but formats, depth and retention differ. A unified provider normalizes them into one schema so you can query several venues in one request. Check that any source includes order book snapshots and settlements, not only prices.
Is a prediction market price the true probability of a team winning?
Not exactly. The price reflects supply, demand, fees and the spread set by liquidity providers. It is a useful estimate, but it can sit slightly above or below the fair probability, especially in thin markets. Use the midpoint and depth together, and test calibration on settled markets.
Can I find the same game on Kalshi, Polymarket and Limitless?
Often, but the contracts are not always identical. Wording, thresholds and rules for postponements or overtime can differ. Map each market to a canonical event and compare resolution terms before treating any price gap as arbitrage.
Do I need wallet-level data for sports markets?
You do not need it to chart prices, but you do for Smart Money tracking and skill scoring. It is available on venues where trades are recorded on-chain. It lets you separate consistent performers from noise.
How should I keep records for taxes?
Save every fill and settlement with timestamps, prices, sizes and fees. IRS guidance on these contracts was still absent as of mid-2026, so itemized records protect you under any classification. A tax professional can advise on reporting.
Sources
Other Blog


