Python Prediction Market Data: Developer API Guide
Python Prediction Market Data: Developer API Guide
Python Prediction Market Data: Developer API Guide
Unlock insights with Python prediction market data using a unified API. Access nearly a billion rows for powerful analysis and backtesting.

Python Prediction Market Data: Developer API Guide
How Python developers access US prediction market data
The fastest path to cross-venue prediction market data in Python runs through a unified API. Building separate clients for Polymarket, Kalshi, and Limitless individually means maintaining three authentication flows, three schema mappings, and three failure modes. A unified data layer like Assymetrix collapses that into one endpoint, one schema, and nearly one billion rows of normalized historical trading activity.
Core components of any Python prediction market workflow:
Data ingestion:
requestsfor REST snapshots,websocketsfor live order book streamsValidation:
pydanticto enforce schemas before data enters your pipelineAnalysis:
pandasDataFrames for price history, volume, and spread calculationsSignal generation: cross-venue spread detection and divergence scoring
Backtesting: replay on historical price snapshots across venues
Execution: feeding processed signals into algorithmic bots programmatically
Prediction markets aggregate diverse perspectives into real-time probability assessments, making their price series more actionable than traditional polling for quantitative research and AI agent development.
Table of Contents
Connecting Python to prediction market APIs: libraries, code, and signals
What alternative data adds to prediction market analysis
Visualizing prediction market data in Python
Storing and managing large prediction market datasets
Assymetrix gives you cross-venue data without the integration overhead
Key Takeaways
Connecting Python to prediction market APIs: libraries, code, and signals
Library setup and authentication

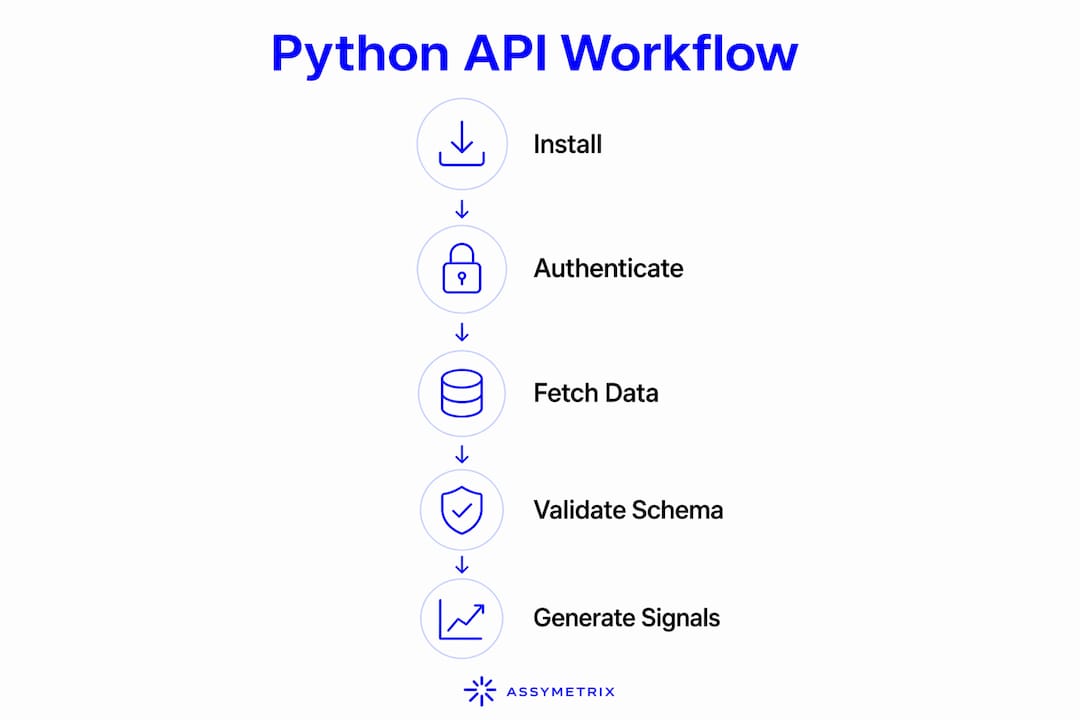
Install the essentials: pip install requests pandas websockets pydantic. Then authenticate against the Assymetrix Data API at data.assymetrix.com using an environment variable for your key — never hard-code secrets in trading scripts.
import os, requests, pandas as pd

API_KEY = os.environ["ASSYMETRIX_API_KEY"]
BASE    = "https://data.assymetrix.com/v1"
HEADERS = {"Authorization": f"Bearer {API_KEY}"}
import os, requests, pandas as pd

API_KEY = os.environ["ASSYMETRIX_API_KEY"]
BASE    = "https://data.assymetrix.com/v1"
HEADERS = {"Authorization": f"Bearer {API_KEY}"}
Pro Tip: Store all credentials in a .env file and load them with python-dotenv. Add .env to .gitignore before your first commit.
Fetching price history and order book snapshots
# Cross-venue price history
resp = requests.get(f"{BASE}/markets/price-history",
                    headers=HEADERS,
                    params={"venue": "all", "market_id": "MARKET_ID", "limit": 500})
df = pd.DataFrame(resp.json()["data"])
df["timestamp"] = pd.to_datetime(df["timestamp"])
df.set_index("timestamp", inplace=True)

# Order book snapshot
book = requests.get(f"{BASE}/markets/orderbook",
                    headers=HEADERS,
                    params={"venue": "polymarket", "market_id": "MARKET_ID"}).json()
spread = book["asks"][0]["price"] - book["bids"][0]["price"]
# Cross-venue price history
resp = requests.get(f"{BASE}/markets/price-history",
                    headers=HEADERS,
                    params={"venue": "all", "market_id": "MARKET_ID", "limit": 500})
df = pd.DataFrame(resp.json()["data"])
df["timestamp"] = pd.to_datetime(df["timestamp"])
df.set_index("timestamp", inplace=True)

# Order book snapshot
book = requests.get(f"{BASE}/markets/orderbook",
                    headers=HEADERS,
                    params={"venue": "polymarket", "market_id": "MARKET_ID"}).json()
spread = book["asks"][0]["price"] - book["bids"][0]["price"]
Schema validation with pydantic catches malformed records before they corrupt downstream logic. Define a MarketPrice model and parse each row on ingestion.
Generating signals and backtesting
Cross-venue spreads are the simplest signal: the same event priced at 0.61 on Polymarket and 0.57 on Kalshi is a 4-cent arbitrage candidate. Detect it in pandas with a pivot and a column diff. For backtesting strategies, replay the normalized price history chronologically, apply your entry/exit logic, and track P&L per resolved market.
REST endpoints suit periodic research pulls; websocket streams are necessary for high-frequency signal generation where milliseconds matter.
Best practices for data handling:
Drop or forward-fill missing price rows only after confirming the gap is a feed outage, not a genuine no-trade period
Pin dependency versions with
condaorpip freezefor reproducible backtestsPartition stored data by venue and date to keep query times predictable
What alternative data adds to prediction market analysis
Raw contract prices tell you what the crowd believes. Alternative data tells you why it shifted. Wallet-level activity from Assymetrix’s Smart Money tracking shows which addresses moved size before a price jump, giving you a leading signal that price history alone cannot surface. Trader Skill Scores let you weight positions by historical accuracy rather than treating all volume equally. For macro-oriented models, pairing prediction market probabilities with news sentiment feeds or economic release calendars sharpens entry timing. AI-driven stock forecast signals from adjacent financial markets can also confirm or challenge directional bets on correlated prediction market contracts.
Visualizing prediction market data in Python
matplotlib and plotly cover most use cases. Plot probability time series with df["price"].plot() for a quick sanity check; switch to plotly.graph_objects for interactive order book depth charts you can share with a team. Heatmaps built with seaborn work well for cross-venue correlation matrices, showing at a glance which Kalshi and Polymarket contracts move together. For volume anomaly detection, a rolling z-score on trade count flags unusual activity worth investigating programmatically.
Storing and managing large prediction market datasets
Parquet is the right format for prediction market data at scale. It compresses well, preserves column types, and reads fast with pandas or polars. Partition files by venue/year/month so queries scan only the slices they need. For datasets approaching the terabyte range, a columnar store like DuckDB lets you run SQL directly on Parquet files without loading everything into memory. Index on market_id and timestamp for the join patterns that backtesting scripts hit most. Automate ingestion with a scheduled job that appends new rows and validates schema on arrival with pandera before writing to disk.
Assymetrix gives you cross-venue data without the integration overhead

Assymetrix is the direct answer for developers who need structured, normalized prediction market data across Polymarket, Kalshi, and Limitless without building three separate API clients. The Assymetrix Data API at data.assymetrix.com exposes approximately 1.5 terabytes of historical data, nearly one billion rows of trading activity, through a single Python-compatible endpoint. Smart Money wallet tracking, cross-venue arbitrage signals, and Trader Skill Scores are available in the same response layer, not as separate integrations. Free and paid tiers are available; commercial and academic licenses exist for teams with higher volume needs. Start with the prediction market accuracy guide to understand data quality benchmarks, then connect to data.assymetrix.com to begin pulling normalized cross-venue data today.
FAQ
What Python libraries do I need for prediction market data?
requests, pandas, websockets, and pydantic cover the core workflow: REST ingestion, DataFrame analysis, live streaming, and schema validation respectively.
Why use a unified API instead of connecting to each venue separately?
Each venue has its own authentication, schema, and rate limits. A unified endpoint like the Assymetrix Data API normalizes all three into one schema, cutting integration time significantly.
How do I detect cross-venue arbitrage signals in Python?
Pivot your normalized price DataFrame by venue, compute the column difference for the same market, and flag rows where the spread exceeds your threshold. Assymetrix surfaces pre-computed arbitrage signals directly via its API.
What storage format works best for large prediction market datasets?
Parquet, partitioned by venue and date, with DuckDB for SQL queries on large files without full memory loads.
How accurate are prediction market prices as forecasting inputs?
Prediction market time series follow efficient market random walk patterns, which supports reliable statistical confidence intervals — generally more accurate than traditional polling for near-term event forecasting.
Key Takeaways
Unified cross-venue APIs with normalized schemas are the foundation of any reliable Python prediction market data pipeline for trading or research.
Point | Details |
|---|---|
Unified API first | Connecting to Polymarket, Kalshi, and Limitless through one endpoint eliminates three separate schema mappings. |
Validate on ingestion | Use |
REST vs. websockets | REST suits periodic research pulls; websocket streams are required for high-frequency signal generation. |
Parquet for storage | Partition by venue and date; query with DuckDB to avoid loading full datasets into memory. |
Assymetrix | Provides approximately 1.5 TB of normalized historical data and pre-computed cross-venue signals via a single Python-compatible endpoint at |
Python Prediction Market Data: Developer API Guide
How Python developers access US prediction market data
The fastest path to cross-venue prediction market data in Python runs through a unified API. Building separate clients for Polymarket, Kalshi, and Limitless individually means maintaining three authentication flows, three schema mappings, and three failure modes. A unified data layer like Assymetrix collapses that into one endpoint, one schema, and nearly one billion rows of normalized historical trading activity.
Core components of any Python prediction market workflow:
Data ingestion:
requestsfor REST snapshots,websocketsfor live order book streamsValidation:
pydanticto enforce schemas before data enters your pipelineAnalysis:
pandasDataFrames for price history, volume, and spread calculationsSignal generation: cross-venue spread detection and divergence scoring
Backtesting: replay on historical price snapshots across venues
Execution: feeding processed signals into algorithmic bots programmatically
Prediction markets aggregate diverse perspectives into real-time probability assessments, making their price series more actionable than traditional polling for quantitative research and AI agent development.
Table of Contents
Connecting Python to prediction market APIs: libraries, code, and signals
What alternative data adds to prediction market analysis
Visualizing prediction market data in Python
Storing and managing large prediction market datasets
Assymetrix gives you cross-venue data without the integration overhead
Key Takeaways
Connecting Python to prediction market APIs: libraries, code, and signals
Library setup and authentication
Install the essentials: pip install requests pandas websockets pydantic. Then authenticate against the Assymetrix Data API at data.assymetrix.com using an environment variable for your key — never hard-code secrets in trading scripts.
import os, requests, pandas as pd

API_KEY = os.environ["ASSYMETRIX_API_KEY"]
BASE    = "https://data.assymetrix.com/v1"
HEADERS = {"Authorization": f"Bearer {API_KEY}"}
Pro Tip: Store all credentials in a .env file and load them with python-dotenv. Add .env to .gitignore before your first commit.
Fetching price history and order book snapshots
# Cross-venue price history
resp = requests.get(f"{BASE}/markets/price-history",
                    headers=HEADERS,
                    params={"venue": "all", "market_id": "MARKET_ID", "limit": 500})
df = pd.DataFrame(resp.json()["data"])
df["timestamp"] = pd.to_datetime(df["timestamp"])
df.set_index("timestamp", inplace=True)

# Order book snapshot
book = requests.get(f"{BASE}/markets/orderbook",
                    headers=HEADERS,
                    params={"venue": "polymarket", "market_id": "MARKET_ID"}).json()
spread = book["asks"][0]["price"] - book["bids"][0]["price"]
Schema validation with pydantic catches malformed records before they corrupt downstream logic. Define a MarketPrice model and parse each row on ingestion.
Generating signals and backtesting
Cross-venue spreads are the simplest signal: the same event priced at 0.61 on Polymarket and 0.57 on Kalshi is a 4-cent arbitrage candidate. Detect it in pandas with a pivot and a column diff. For backtesting strategies, replay the normalized price history chronologically, apply your entry/exit logic, and track P&L per resolved market.
REST endpoints suit periodic research pulls; websocket streams are necessary for high-frequency signal generation where milliseconds matter.
Best practices for data handling:
Drop or forward-fill missing price rows only after confirming the gap is a feed outage, not a genuine no-trade period
Pin dependency versions with
condaorpip freezefor reproducible backtestsPartition stored data by venue and date to keep query times predictable
What alternative data adds to prediction market analysis
Raw contract prices tell you what the crowd believes. Alternative data tells you why it shifted. Wallet-level activity from Assymetrix’s Smart Money tracking shows which addresses moved size before a price jump, giving you a leading signal that price history alone cannot surface. Trader Skill Scores let you weight positions by historical accuracy rather than treating all volume equally. For macro-oriented models, pairing prediction market probabilities with news sentiment feeds or economic release calendars sharpens entry timing. AI-driven stock forecast signals from adjacent financial markets can also confirm or challenge directional bets on correlated prediction market contracts.
Visualizing prediction market data in Python
matplotlib and plotly cover most use cases. Plot probability time series with df["price"].plot() for a quick sanity check; switch to plotly.graph_objects for interactive order book depth charts you can share with a team. Heatmaps built with seaborn work well for cross-venue correlation matrices, showing at a glance which Kalshi and Polymarket contracts move together. For volume anomaly detection, a rolling z-score on trade count flags unusual activity worth investigating programmatically.
Storing and managing large prediction market datasets
Parquet is the right format for prediction market data at scale. It compresses well, preserves column types, and reads fast with pandas or polars. Partition files by venue/year/month so queries scan only the slices they need. For datasets approaching the terabyte range, a columnar store like DuckDB lets you run SQL directly on Parquet files without loading everything into memory. Index on market_id and timestamp for the join patterns that backtesting scripts hit most. Automate ingestion with a scheduled job that appends new rows and validates schema on arrival with pandera before writing to disk.
Assymetrix gives you cross-venue data without the integration overhead
Assymetrix is the direct answer for developers who need structured, normalized prediction market data across Polymarket, Kalshi, and Limitless without building three separate API clients. The Assymetrix Data API at data.assymetrix.com exposes approximately 1.5 terabytes of historical data, nearly one billion rows of trading activity, through a single Python-compatible endpoint. Smart Money wallet tracking, cross-venue arbitrage signals, and Trader Skill Scores are available in the same response layer, not as separate integrations. Free and paid tiers are available; commercial and academic licenses exist for teams with higher volume needs. Start with the prediction market accuracy guide to understand data quality benchmarks, then connect to data.assymetrix.com to begin pulling normalized cross-venue data today.
FAQ
What Python libraries do I need for prediction market data?
requests, pandas, websockets, and pydantic cover the core workflow: REST ingestion, DataFrame analysis, live streaming, and schema validation respectively.
Why use a unified API instead of connecting to each venue separately?
Each venue has its own authentication, schema, and rate limits. A unified endpoint like the Assymetrix Data API normalizes all three into one schema, cutting integration time significantly.
How do I detect cross-venue arbitrage signals in Python?
Pivot your normalized price DataFrame by venue, compute the column difference for the same market, and flag rows where the spread exceeds your threshold. Assymetrix surfaces pre-computed arbitrage signals directly via its API.
What storage format works best for large prediction market datasets?
Parquet, partitioned by venue and date, with DuckDB for SQL queries on large files without full memory loads.
How accurate are prediction market prices as forecasting inputs?
Prediction market time series follow efficient market random walk patterns, which supports reliable statistical confidence intervals — generally more accurate than traditional polling for near-term event forecasting.
Key Takeaways
Unified cross-venue APIs with normalized schemas are the foundation of any reliable Python prediction market data pipeline for trading or research.
Point | Details |
|---|---|
Unified API first | Connecting to Polymarket, Kalshi, and Limitless through one endpoint eliminates three separate schema mappings. |
Validate on ingestion | Use |
REST vs. websockets | REST suits periodic research pulls; websocket streams are required for high-frequency signal generation. |
Parquet for storage | Partition by venue and date; query with DuckDB to avoid loading full datasets into memory. |
Assymetrix | Provides approximately 1.5 TB of normalized historical data and pre-computed cross-venue signals via a single Python-compatible endpoint at |