Prediction Market OHLCV Candles API Guide for Developers
Prediction Market OHLCV Candles API Guide for Developers
Prediction Market OHLCV Candles API Guide for Developers
Unlock the power of prediction market OHLCV data with our API guide. Simplify candle construction and enhance your charting capabilities.
Prediction Market OHLCV Candles API Guide for Developers
Use precomputed OHLCV candles from a unified prediction market data API rather than reconstructing them from raw trade streams. The Assymetrix /sdk/markets/:id/pricing endpoint delivers normalized, probability-scaled candles across Polymarket, Kalshi, and Limitless in a single request. They are ready for charting libraries and backtesting engines with no additional aggregation logic on your end. Building candles from scratch introduces subtle inclusion-rule errors, timezone drift, and late-trade ambiguity that compound quickly at scale. Starting from precomputed candles eliminates that entire class of bug.
Key Takeaways
Precomputed OHLCV candles from a unified prediction market API eliminate reconstruction errors, enforce probability semantics, and deliver production-ready data for charting and backtesting in a single endpoint call.
Point | Details |
|---|---|
Use precomputed candles | Fetch from |
Normalize to UTC | Store all timestamps as Unix seconds in UTC; convert to local time only at the display layer. |
Sample closes for backtests | Use candle close prices as signal inputs; mid-candle sampling introduces lookahead bias. |
Validate volume and payouts | Check |
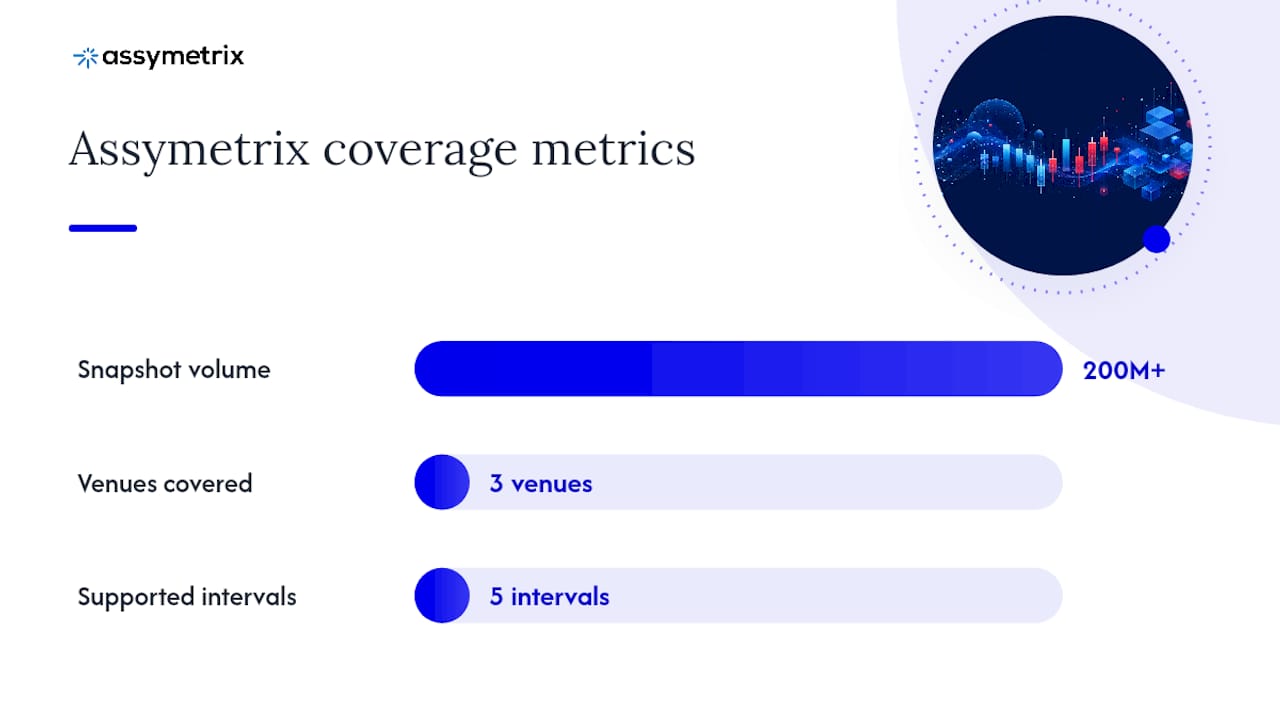
Assymetrix coverage | 200M+ snapshots at 15-minute resolution across Polymarket, Kalshi, and Limitless, with unified schema and payout fields. |
Table of Contents
What does OHLCV mean for prediction market candles?
How do providers compute candles from raw trade events?
Which prediction market venues does OHLCV coverage include?
How do you request OHLCV candles from the API?
What intervals and schema fields should you expect?
How do you compute OHLCV from raw trade streams?
How do you backtest strategies using prediction market OHLCV?
What are the most common OHLCV pitfalls and how do you fix them?
How does Assymetrix deliver production-ready OHLCV data?
Which open-source libraries help with candlestick detection and validation?
An engineering perspective on running OHLCV pipelines at scale
Assymetrix: your unified source for prediction market candle data
Sources
What does OHLCV mean for prediction market candles?
In financial markets, open/high/low/close represent asset prices in dollars. In prediction markets, they represent probabilities. Every OHLCV field is bounded between 0 and 1 (or equivalently 0–100 if the venue scales to percentage points).
This distinction has direct consequences for how you build charts and models:
Axis labeling: The Y-axis is a probability axis, not a price axis. Label it “Implied Probability (%)” and cap it at 100.
Color conventions: Standard green/red candlestick coloring still applies (close > open = bullish bar), but the interpretation is directional probability movement, not price appreciation.
Scaling: Never normalize or log-transform the close series the way you would for an asset price. The 0–1 bound is meaningful and must be preserved.
Volume semantics: Volume in prediction markets measures traded probability quantity (the sum of taker-side fill sizes), not dollar notional or share count. On some venues it reflects minted collateral units; on others it is purely the taker fill quantity. These are not interchangeable, and mixing them across venues without normalization produces misleading volume overlays.
Field | Financial markets | Prediction markets |
|---|---|---|
Open / High / Low / Close | Asset price (USD) | Implied probability (0–1 or 0–100) |
Volume | Shares or notional | Traded probability quantity (taker-side) |
Axis range | Unbounded | Strictly 0–1 (or 0–100) |
Pro Tip: Always store and transmit probabilities in the 0–1 range internally, then multiply by 100 only at the display layer. Mixing representations across pipeline stages is the fastest way to introduce a silent factor-of-100 bug in your Brier score calculations.
Candlestick charts pack all five fields into a single bar and are the standard structure for spotting directional or reversal signals, but the pattern semantics shift when the underlying price series is probability-bounded. A “doji” at 0.98 carries a very different implication than one at 0.50.
How do providers compute candles from raw trade events?
Candles are bucketed summaries of trade events and order fills. Every provider follows roughly the same aggregation pipeline, but the edge cases in each step are where implementations diverge and where reconstruction errors accumulate.
The conceptual flow runs like this: raw trade events (OrderFilled events on-chain, or REST trade feeds on centralized venues) arrive in an ingestion buffer. Each event is normalized to a canonical schema (timestamp in UTC, outcome identifier, price as probability, fill size). The normalized event is then assigned to a time bucket based on its timestamp field and the requested interval. Within each bucket, the aggregation functions apply: open is the price of the first event by timestamp, high is the maximum price, low is the minimum, close is the price of the last event, and volume is the sum of fill sizes. Once a bucket’s time window closes, it is finalized and persisted.
The hardest part of candle computation is not the aggregation math. It is deciding which events belong to which bucket. Late-arriving trades, out-of-order delivery, and correction events all challenge the assumption that events arrive in timestamp order. A precomputed candle from a production API has already resolved these inclusion rules; a self-built pipeline must define and enforce them explicitly or accept non-deterministic output.
Common edge cases your pipeline must handle:
Late trades: A fill event arrives after the bucket’s close time. You need a watermark policy: either include it in the already-finalized bucket (requires reopen/rewrite) or assign it to the next bucket (distorts the next candle’s open).
Trade corrections: Some venues emit correction or cancellation events. If you have already aggregated the original fill, you must subtract it and recompute the affected bucket.
Resolution events: When a market resolves, the final payout price (0 or 1, or a fractional value for multi-outcome markets) is not a trade. It must be injected as a synthetic event or captured in a dedicated
payoutClosefield, not folded into the close price of the last trading candle.Partial fills: A single order may generate multiple fill events at slightly different prices. Each fill is a separate trade event and must be treated individually during aggregation.
Resolved-market payouts deserve special handling. Production OHLC endpoints expose dedicated payout fields (payoutOpen, payoutClose, payoutHigh, payoutLow, payoutMid) alongside the standard OHLCV fields for candles that span or follow a resolution event. These fields reflect the payout-adjusted probability rather than the last traded price, and they are what you should use when computing post-resolution Brier scores. The Jon-Becker/prediction-market-analysis framework documents Parquet schemas and indexers for Polymarket and Kalshi that handle exactly this separation between trade-derived and payout-derived fields.
Which prediction market venues does OHLCV coverage include?
Most production-grade aggregated APIs cover four venues: Polymarket, Kalshi, Manifold, and Limitless. Coverage means different things at each layer.
Polymarket provides on-chain OrderFilled events as the primary trade source. Candle reconstruction requires indexing these events from the CLOB contract. Historical depth extends back to the venue’s launch, though early data is sparse.
Kalshi exposes a REST trade feed and order book snapshots. Candle data can be derived from trade fills or from order book mid-price snapshots at interval boundaries. The two methods produce different OHLCV series, particularly for low-liquidity markets.
Manifold operates on a different market mechanism (automated market maker rather than a CLOB), so “price” is the AMM’s current probability estimate rather than a matched fill price. Volume semantics differ accordingly.
Limitless provides trade-based fills similar to Polymarket’s model.
Cross-venue normalization requires three things: a unified outcome identifier (since the same real-world event may have different market IDs across venues), consistent probability scaling (all venues to 0–1), and a decision on which volume definition to use when venues report it differently. The Assymetrix unified schema maps venue-specific fields to a canonical model so downstream consumers do not need to handle venue quirks individually.
Historical depth varies. Polymarket data goes back to 2020 for some markets; Kalshi’s regulated history starts from its launch in 2021. Manifold and Limitless have shorter histories. Live updates arrive via REST snapshot or streaming depending on the provider.
How do you request OHLCV candles from the API?
The core endpoint pattern follows a path-style structure with query parameters for the outcome identifier, interval, and time range. The OHLC candlestick endpoint accepts market, token_id or outcome_index, interval, start_ts, end_ts, and limit as its primary parameters.
A minimal curl request looks like this:
curl -X GET "https://data.assymetrix.com/sdk/markets/{market_id}/pricing?interval=15m&start_ts=1700000000&end_ts=1700086400&limit=100" \
  -H "Authorization: Bearer YOUR_API_TOKEN"
curl -X GET "https://data.assymetrix.com/sdk/markets/{market_id}/pricing?interval=15m&start_ts=1700000000&end_ts=1700086400&limit=100" \
  -H "Authorization: Bearer YOUR_API_TOKEN"
The equivalent Python call using requests:
import requests

BASE_URL = "https://data.assymetrix.com"
TOKEN = "YOUR_API_TOKEN"

def fetch_candles(market_id, interval="15m", start_ts=None, end_ts=None, limit=100):
    params = {
        "interval": interval,
        "start_ts": start_ts,
        "end_ts": end_ts,
        "limit": limit,
    }
    headers = {"Authorization": f"Bearer {TOKEN}"}
    resp = requests.get(
        f"{BASE_URL}/sdk/markets/{market_id}/pricing",
        params={k: v for k, v in params.items() if v is not None},
        headers=headers,
    )
    resp.raise_for_status()
    return resp.json()
import requests

BASE_URL = "https://data.assymetrix.com"
TOKEN = "YOUR_API_TOKEN"

def fetch_candles(market_id, interval="15m", start_ts=None, end_ts=None, limit=100):
    params = {
        "interval": interval,
        "start_ts": start_ts,
        "end_ts": end_ts,
        "limit": limit,
    }
    headers = {"Authorization": f"Bearer {TOKEN}"}
    resp = requests.get(
        f"{BASE_URL}/sdk/markets/{market_id}/pricing",
        params={k: v for k, v in params.items() if v is not None},
        headers=headers,
    )
    resp.raise_for_status()
    return resp.json()
A trimmed example JSON response:
{
  "data": [
    {
      "t": 1700000000,
      "o": 0.61,
      "h": 0.65,
      "l": 0.59,
      "c": 0.63,
      "v": 4200.5,
      "market_id": "abc123",
      "outcome_id": "yes",
      "payoutClose": null
    }
  ],
  "next_cursor": "eyJ0IjoxNzAwMDg2NDAwfQ=="
}
{
  "data": [
    {
      "t": 1700000000,
      "o": 0.61,
      "h": 0.65,
      "l": 0.59,
      "c": 0.63,
      "v": 4200.5,
      "market_id": "abc123",
      "outcome_id": "yes",
      "payoutClose": null
    }
  ],
  "next_cursor": "eyJ0IjoxNzAwMDg2NDAwfQ=="
}
Key parameter semantics:
interval: enum string (1m,5m,15m,1h,1d). Defaults vary by provider; always specify explicitly.start_ts/end_ts: Unix timestamps in seconds (UTC). Omittingend_tsreturns up to the most recent finalized candle.limit: maximum candles per page. Paginate using thenext_cursorvalue returned in each response.outcome_id/token_id: the specific outcome within a multi-outcome market (e.g., “yes” vs. “no” for a binary market).
Pro Tip: For bulk historical pulls, set limit to the maximum allowed value and implement exponential backoff on 429 responses. Cache the next_cursor to disk after each page so a failed run resumes without re-fetching already-retrieved candles.
Rate limits on most prediction market APIs sit in the range of tens to hundreds of requests per minute for authenticated users. Check the Retry-After header on 429 responses and respect it. For the real-time Kalshi and Polymarket data use case, prefer streaming endpoints over repeated REST polling to reduce both latency and request count.
What intervals and schema fields should you expect?
Supported intervals typically include 1m, 5m, 15m, 1h, and 1d. Some providers also expose 3m and 30m. Bucket alignment follows UTC boundaries: a 1h candle starting at 14:00 UTC closes at 14:59:59 UTC, and the next opens at 15:00:00 UTC.
Interval | Bucket alignment | Typical use case |
|---|---|---|
1m | UTC minute boundary | Intraday signal research, thin-market monitoring |
5m | UTC 5-minute boundary | Short-term momentum signals |
15m | UTC 15-minute boundary | Standard backtesting resolution |
1h | UTC hour boundary | Swing signals, daily pattern detection |
1d | UTC midnight boundary | Calibration, long-horizon backtests |
The canonical schema fields are:
t: bucket open timestamp (Unix seconds, UTC)o,h,l,c: open, high, low, close probabilities (0–1)v: volume (traded probability quantity, taker-side)market_id: venue-agnostic market identifieroutcome_id: specific outcome within the marketpayoutOpen,payoutClose,payoutHigh,payoutLow,payoutMid: payout-adjusted fields for resolved markets (null for active markets)
The t field always represents the start of the bucket, not the end. When you join candle data from multiple venues, confirm this convention holds for each source before merging. A mismatch between “bucket start” and “bucket end” timestamp conventions will shift your entire time series by one interval and corrupt any event-time alignment you build on top of it.
Pro Tip: Normalize all timestamps to UTC immediately on ingestion. Store them as integer Unix seconds in your database, and convert to local time only at the display layer. Never store timezone-aware strings in your candle table.
Still-forming candles (the current, not-yet-closed bucket) are returned by most APIs with a flag or by convention as the last element in the response. Treat them as provisional: do not use them as signal inputs in live strategies until the bucket finalizes, and never persist them as final in your historical store.
How do you compute OHLCV from raw trade streams?
If you must build candles from raw trades rather than consuming precomputed ones, the pseudocode below covers the core aggregation loop and the most common edge cases.
from collections import defaultdict

def compute_candles(trades, interval_seconds):
    buckets = defaultdict(lambda: {"o": None, "h": -inf, "l": inf, "c": None, "v": 0.0})

    for trade in sorted(trades, key=lambda t: t["timestamp"]):
        bucket_ts = (trade["timestamp"] // interval_seconds) * interval_seconds
        b = buckets[bucket_ts]
        price = trade["price"]   # probability 0–1
        size  = trade["size"]    # taker fill quantity

        if b["o"] is None:
            b["o"] = price
        b["h"] = max(b["h"], price)
        b["l"] = min(b["l"], price)
        b["c"] = price
        b["v"] += size

    return [{"t": ts, **fields} for ts, fields in sorted(buckets.items())]
from collections import defaultdict

def compute_candles(trades, interval_seconds):
    buckets = defaultdict(lambda: {"o": None, "h": -inf, "l": inf, "c": None, "v": 0.0})

    for trade in sorted(trades, key=lambda t: t["timestamp"]):
        bucket_ts = (trade["timestamp"] // interval_seconds) * interval_seconds
        b = buckets[bucket_ts]
        price = trade["price"]   # probability 0–1
        size  = trade["size"]    # taker fill quantity

        if b["o"] is None:
            b["o"] = price
        b["h"] = max(b["h"], price)
        b["l"] = min(b["l"], price)
        b["c"] = price
        b["v"] += size

    return [{"t": ts, **fields} for ts, fields in sorted(buckets.items())]
The implementation steps in production order:
Sort by timestamp before bucketing. Out-of-order delivery is common on on-chain sources.
Assign to bucket using integer division:
bucket_ts = (ts // interval_s) * interval_s.Aggregate open (first price), high (max), low (min), close (last price), volume (sum of sizes).
Watermark late trades. Set a watermark at
max_seen_ts - grace_period. Any trade withtimestamp < watermarkthat arrives after finalization triggers a backfill rewrite, not a new bucket assignment.Finalize and persist completed buckets to Parquet or a columnar store. Mark in-flight buckets with an
is_final = falseflag.
Volume in probability markets is the sum of taker fill sizes in probability units. Do not convert to dollar notional unless you are explicitly building a dollar-volume overlay. Mixing units silently is the most common volume bug.
For storage, Parquet with Snappy compression and partitioning by (venue, market_id, interval, date) gives efficient range scans for backtests. The prediction-market-analysis framework uses this exact layout with resumable indexers and checkpointing.
Pro Tip: Generate a set of synthetic trades with known OHLCV output and run your aggregation function against them as a unit test. Then fetch the same time range from a precomputed API and compare checksums. Any divergence reveals an inclusion-rule bug before it reaches production.
How do you backtest strategies using prediction market OHLCV?
Use the close price at candle end as the observable probability for signal inputs and scoring. Mid-candle sampling introduces lookahead bias because the high and low within a candle are not observable at the candle’s open. Sample the close, not the mid.
The Brier score is the standard calibration metric for prediction market strategies. For a set of predictions $p_i$ against binary outcomes $o_i \in {0, 1}$:
$$BS = \frac{1}{N} \sum_{i=1}^{N} (p_i - o_i)^2$$
Lower is better. A score of 0.25 corresponds to random guessing on a 50/50 market. A cross-market analysis of 3,587 markets spanning June 2021 through November 2025 demonstrates how calibration curves and volume breakdowns across markets provide the aggregated metrics needed to evaluate backtest plausibility, including pricing accuracy and liquidity signals.
To compute the Brier score against resolved outcomes using candle data:
Align each prediction to the candle close at the signal time (use
t + interval_secondsas the observation timestamp).Join to the resolved outcome using
payoutClose(1.0 for “yes” resolution, 0.0 for “no”).Compute
(close - payoutClose)^2per candle and average across the evaluation window.
Backtest checklist:
Fill-forward gaps: Markets with no trades in an interval produce no candle. Fill forward the last known close for signal continuity, but zero out volume for that bucket.
Resolution-event handling: Exclude candles after the
payoutClosefield becomes non-null from your signal generation window. Post-resolution candles have no predictive content.Event-time vs. wall-clock sampling: Use candle
t(bucket open timestamp) as the event time for all joins. Never use ingestion time or API response time.Volume weighting: Weight signal observations by volume to reduce noise from thin-liquidity candles. A candle with
v < thresholdis a weak signal regardless of its close value.
For a 15-minute intraday signal, fetch candles at interval=15m, compute your signal on the close series, and assume execution at the open of the next candle. That one-candle lag is the minimum realistic execution assumption for a non-HFT strategy. The backtesting walkthrough on Assymetrix covers sampling, weighting, and calibration in detail.
Pairing OHLCV with the Brier score tells you whether a strategy captures genuine predictive alpha or just tracks public polling shifts. Volume-weighted Brier scores are more informative than unweighted ones for thinly traded markets.
What are the most common OHLCV pitfalls and how do you fix them?
Run automated data-quality checks on every candle batch before it enters your signal pipeline. The failure modes below are ordered by how often they appear in production.
Validation checklist:
Timestamp monotonicity:
t[i+1] == t[i] + interval_secondsfor every consecutive pair. Any gap signals a missing candle.Probability bounds:
0 <= o, h, l, c <= 1for every row. A value outside this range indicates a unit mismatch (percentage vs. decimal).OHLC consistency:
l <= o, c <= handl <= h. Violations indicate aggregation bugs.No-op candles:
o == h == l == cwithv == 0is a fill-forward artifact, not a real candle. Flag these separately.Volume threshold: Alert when
v < min_volume_thresholdfor more than N consecutive candles. Sustained zero-volume periods often mean the market is stale or the feed has dropped.Payout sanity: For resolved markets,
payoutClosemust be 0.0 or 1.0 for binary outcomes. A value outside that range is a data error.
Alert conditions and mitigations:
Gap detected (missing candle): request a backfill for the missing range, then mark the affected candles as
backfilled = truein your store.Probability out of bounds: quarantine the candle, log the raw event, and request the source record for manual inspection.
Volume spike (> 10x rolling average): flag for review but do not discard. Large volume spikes around news events are real.
Unfinalized candle persisted as final: set
is_final = falseon the current bucket and re-fetch after the interval closes.
Reconciling REST historical pulls against streaming snapshots requires a two-pass approach: fetch the historical range via REST, then apply streaming deltas for the current day. Where they overlap, prefer the REST-sourced candle as the authoritative record and treat the streaming candle as provisional until the bucket closes.
How does Assymetrix deliver production-ready OHLCV data?
Assymetrix delivers precomputed, normalized OHLCV candles for Polymarket, Kalshi, and Limitless through the /sdk/markets/:id/pricing endpoint. The schema follows the canonical field names (t, o, h, l, c, v, market_id, outcome_id) with payoutClose and related payout fields populated for resolved markets. No post-processing is required before passing the response to a charting library.
The platform is built on extensive historical data spanning a large number of rows of trading activity, with hundreds of millions of price snapshots at 15-minute resolution. That depth supports multi-year backtests across all three venues without gaps in the major markets.
Metric | Assymetrix coverage |
|---|---|
Venues | Polymarket, Kalshi, Limitless |
Historical depth | Multi-year (venue launch to present) |
Snapshot volume | 200M+ at 15-minute resolution |
Supported intervals | 1m, 5m, 15m, 1h, 1d |
Schema | Unified (canonical field names, UTC timestamps) |
Payout fields | payoutOpen, payoutClose, payoutHigh, payoutLow, payoutMid |
Integration options beyond the REST endpoint include CSV and Parquet bulk exports for teams that prefer offline analysis, and a streaming layer for live candle updates. The Python developer guide covers SDK installation, authentication, and sample ingestion patterns. For teams building AI agents that consume live probability feeds, the AI agent integration guide covers the same endpoint in an autonomous execution context.
The unified schema handles cross-venue normalization automatically. Venue-specific identifiers are mapped to canonical market_id and outcome_id values, probability scaling is standardized to 0–1, and timezone alignment is enforced at ingestion. You do not need to write venue-specific parsing logic.
Which open-source libraries help with candlestick detection and validation?
For Python developers, CandleKit provides multi-candle pattern detectors with a pandas-friendly API, built-in demo OHLCV generators, and plotting utilities for annotating detected patterns. Feed it a DataFrame with lowercase column names (open, high, low, close, volume) and UTC-indexed timestamps and it integrates without field renaming.
The klineR package on CRAN exposes demo_ohlcv() generators and a pattern catalog with plotting helpers, making it practical for R-based quant workflows and for generating synthetic test data with known pattern outputs.
For JavaScript and TypeScript environments, the OHLC_Candlestick_Patterns library implements a streaming detection API with TypeScript packaging, useful for large-scale pattern scans in server-side Node.js pipelines or browser-based charting dashboards.
Integration tips:
Map Assymetrix field names (
o,h,l,c,v) to the library’s expected column names at the adapter layer, not inside your core pipeline.Use the library’s synthetic data generators to build unit tests with known pattern outputs before running against live candle data.
Annotate resolution events on charts using a vertical line or marker at the candle where
payoutClosebecomes non-null. Preserve payout markers so analysts can visually separate the trading period from the resolved state.
Pro Tip: Add candlestick pattern detection to your CI pipeline using synthetic OHLCV fixtures. A deterministic replay of known patterns catches regressions in your detection logic before they reach production dashboards.
An engineering perspective on running OHLCV pipelines at scale
The failure mode that costs the most time in production is not the aggregation logic. It is the silent gap: a market goes quiet for six hours, your pipeline produces no candles for that window, and your backtest fill-forward logic propagates a stale close into a signal that fires on the next active candle. The signal looks real. The trade looks plausible. The Brier score looks fine. But the input was six hours old.
The fix is a monitoring layer that distinguishes between “no trades in this interval” (a legitimate sparse candle) and “the feed stopped delivering” (a pipeline failure). Emit a heartbeat metric for every interval boundary, even when no candle is produced. Alert when heartbeats stop, not when candles stop. Checkpoint your watermark position to durable storage after every batch so a restart resumes from the last confirmed position rather than re-fetching the entire history.
Assymetrix: your unified source for prediction market candle data
The Prediction Market Data Feed API Guide is the fastest path from zero to a working OHLCV integration. It covers authentication, endpoint parameters, rate limits, and pagination for the /sdk/markets/:id/pricing endpoint across all three supported venues.

Assymetrix gives developers and quant researchers a single integration point for normalized, production-ready candle data across Polymarket, Kalshi, and Limitless, backed by 200M+ price snapshots and nearly one billion rows of historical trading activity. The schema is unified, the timestamps are UTC-aligned, and payout fields for resolved markets are included out of the box. No venue-specific parsing, no reconstruction logic, no timezone gymnastics. Start with the developer API guide to get your first candle response in under ten minutes, or access the full data platform at Data to explore historical coverage and bulk export options.
Sources
FAQ
What does OHLCV mean in a prediction market context?
Open, high, low, close, and volume represent implied probabilities (0–1) and traded probability quantity rather than asset prices or share counts. The Y-axis on a prediction market candlestick chart is a probability axis capped at 1.0.
How far back does historical OHLCV data go for Polymarket and Kalshi?
Polymarket data is available back to the venue’s 2020 launch for major markets; Kalshi’s regulated history starts from its 2021 launch. Assymetrix aggregates both into a unified historical store with 200M+ price snapshots at 15-minute resolution.
What is the Brier score and how do you compute it from candle data?
The Brier score is the mean squared error between predicted probabilities and binary outcomes: BS = mean((close - payoutClose)^2). Align each candle close to its resolved outcome using the payoutClose field and average across the evaluation window.

How do you handle missing candles caused by low liquidity?
Fill forward the last known close for signal continuity and set volume to zero for the empty bucket. Flag these fill-forward candles separately and exclude them from volume-weighted signal calculations.
Which intervals does the Assymetrix OHLCV endpoint support?
The /sdk/markets/:id/pricing endpoint supports 1m, 5m, 15m, 1h, and 1d intervals. All buckets align to UTC boundaries. Specify the interval explicitly in every request; do not rely on provider defaults.
Prediction Market OHLCV Candles API Guide for Developers
Use precomputed OHLCV candles from a unified prediction market data API rather than reconstructing them from raw trade streams. The Assymetrix /sdk/markets/:id/pricing endpoint delivers normalized, probability-scaled candles across Polymarket, Kalshi, and Limitless in a single request. They are ready for charting libraries and backtesting engines with no additional aggregation logic on your end. Building candles from scratch introduces subtle inclusion-rule errors, timezone drift, and late-trade ambiguity that compound quickly at scale. Starting from precomputed candles eliminates that entire class of bug.
Key Takeaways
Precomputed OHLCV candles from a unified prediction market API eliminate reconstruction errors, enforce probability semantics, and deliver production-ready data for charting and backtesting in a single endpoint call.
Point | Details |
|---|---|
Use precomputed candles | Fetch from |
Normalize to UTC | Store all timestamps as Unix seconds in UTC; convert to local time only at the display layer. |
Sample closes for backtests | Use candle close prices as signal inputs; mid-candle sampling introduces lookahead bias. |
Validate volume and payouts | Check |
Assymetrix coverage | 200M+ snapshots at 15-minute resolution across Polymarket, Kalshi, and Limitless, with unified schema and payout fields. |
Table of Contents
What does OHLCV mean for prediction market candles?
How do providers compute candles from raw trade events?
Which prediction market venues does OHLCV coverage include?
How do you request OHLCV candles from the API?
What intervals and schema fields should you expect?
How do you compute OHLCV from raw trade streams?
How do you backtest strategies using prediction market OHLCV?
What are the most common OHLCV pitfalls and how do you fix them?
How does Assymetrix deliver production-ready OHLCV data?
Which open-source libraries help with candlestick detection and validation?
An engineering perspective on running OHLCV pipelines at scale
Assymetrix: your unified source for prediction market candle data
Sources
What does OHLCV mean for prediction market candles?
In financial markets, open/high/low/close represent asset prices in dollars. In prediction markets, they represent probabilities. Every OHLCV field is bounded between 0 and 1 (or equivalently 0–100 if the venue scales to percentage points).
This distinction has direct consequences for how you build charts and models:
Axis labeling: The Y-axis is a probability axis, not a price axis. Label it “Implied Probability (%)” and cap it at 100.
Color conventions: Standard green/red candlestick coloring still applies (close > open = bullish bar), but the interpretation is directional probability movement, not price appreciation.
Scaling: Never normalize or log-transform the close series the way you would for an asset price. The 0–1 bound is meaningful and must be preserved.
Volume semantics: Volume in prediction markets measures traded probability quantity (the sum of taker-side fill sizes), not dollar notional or share count. On some venues it reflects minted collateral units; on others it is purely the taker fill quantity. These are not interchangeable, and mixing them across venues without normalization produces misleading volume overlays.
Field | Financial markets | Prediction markets |
|---|---|---|
Open / High / Low / Close | Asset price (USD) | Implied probability (0–1 or 0–100) |
Volume | Shares or notional | Traded probability quantity (taker-side) |
Axis range | Unbounded | Strictly 0–1 (or 0–100) |
Pro Tip: Always store and transmit probabilities in the 0–1 range internally, then multiply by 100 only at the display layer. Mixing representations across pipeline stages is the fastest way to introduce a silent factor-of-100 bug in your Brier score calculations.
Candlestick charts pack all five fields into a single bar and are the standard structure for spotting directional or reversal signals, but the pattern semantics shift when the underlying price series is probability-bounded. A “doji” at 0.98 carries a very different implication than one at 0.50.
How do providers compute candles from raw trade events?
Candles are bucketed summaries of trade events and order fills. Every provider follows roughly the same aggregation pipeline, but the edge cases in each step are where implementations diverge and where reconstruction errors accumulate.
The conceptual flow runs like this: raw trade events (OrderFilled events on-chain, or REST trade feeds on centralized venues) arrive in an ingestion buffer. Each event is normalized to a canonical schema (timestamp in UTC, outcome identifier, price as probability, fill size). The normalized event is then assigned to a time bucket based on its timestamp field and the requested interval. Within each bucket, the aggregation functions apply: open is the price of the first event by timestamp, high is the maximum price, low is the minimum, close is the price of the last event, and volume is the sum of fill sizes. Once a bucket’s time window closes, it is finalized and persisted.
The hardest part of candle computation is not the aggregation math. It is deciding which events belong to which bucket. Late-arriving trades, out-of-order delivery, and correction events all challenge the assumption that events arrive in timestamp order. A precomputed candle from a production API has already resolved these inclusion rules; a self-built pipeline must define and enforce them explicitly or accept non-deterministic output.
Common edge cases your pipeline must handle:
Late trades: A fill event arrives after the bucket’s close time. You need a watermark policy: either include it in the already-finalized bucket (requires reopen/rewrite) or assign it to the next bucket (distorts the next candle’s open).
Trade corrections: Some venues emit correction or cancellation events. If you have already aggregated the original fill, you must subtract it and recompute the affected bucket.
Resolution events: When a market resolves, the final payout price (0 or 1, or a fractional value for multi-outcome markets) is not a trade. It must be injected as a synthetic event or captured in a dedicated
payoutClosefield, not folded into the close price of the last trading candle.Partial fills: A single order may generate multiple fill events at slightly different prices. Each fill is a separate trade event and must be treated individually during aggregation.
Resolved-market payouts deserve special handling. Production OHLC endpoints expose dedicated payout fields (payoutOpen, payoutClose, payoutHigh, payoutLow, payoutMid) alongside the standard OHLCV fields for candles that span or follow a resolution event. These fields reflect the payout-adjusted probability rather than the last traded price, and they are what you should use when computing post-resolution Brier scores. The Jon-Becker/prediction-market-analysis framework documents Parquet schemas and indexers for Polymarket and Kalshi that handle exactly this separation between trade-derived and payout-derived fields.
Which prediction market venues does OHLCV coverage include?
Most production-grade aggregated APIs cover four venues: Polymarket, Kalshi, Manifold, and Limitless. Coverage means different things at each layer.
Polymarket provides on-chain OrderFilled events as the primary trade source. Candle reconstruction requires indexing these events from the CLOB contract. Historical depth extends back to the venue’s launch, though early data is sparse.
Kalshi exposes a REST trade feed and order book snapshots. Candle data can be derived from trade fills or from order book mid-price snapshots at interval boundaries. The two methods produce different OHLCV series, particularly for low-liquidity markets.
Manifold operates on a different market mechanism (automated market maker rather than a CLOB), so “price” is the AMM’s current probability estimate rather than a matched fill price. Volume semantics differ accordingly.
Limitless provides trade-based fills similar to Polymarket’s model.
Cross-venue normalization requires three things: a unified outcome identifier (since the same real-world event may have different market IDs across venues), consistent probability scaling (all venues to 0–1), and a decision on which volume definition to use when venues report it differently. The Assymetrix unified schema maps venue-specific fields to a canonical model so downstream consumers do not need to handle venue quirks individually.
Historical depth varies. Polymarket data goes back to 2020 for some markets; Kalshi’s regulated history starts from its launch in 2021. Manifold and Limitless have shorter histories. Live updates arrive via REST snapshot or streaming depending on the provider.
How do you request OHLCV candles from the API?
The core endpoint pattern follows a path-style structure with query parameters for the outcome identifier, interval, and time range. The OHLC candlestick endpoint accepts market, token_id or outcome_index, interval, start_ts, end_ts, and limit as its primary parameters.
A minimal curl request looks like this:
curl -X GET "https://data.assymetrix.com/sdk/markets/{market_id}/pricing?interval=15m&start_ts=1700000000&end_ts=1700086400&limit=100" \
  -H "Authorization: Bearer YOUR_API_TOKEN"
The equivalent Python call using requests:
import requests

BASE_URL = "https://data.assymetrix.com"
TOKEN = "YOUR_API_TOKEN"

def fetch_candles(market_id, interval="15m", start_ts=None, end_ts=None, limit=100):
    params = {
        "interval": interval,
        "start_ts": start_ts,
        "end_ts": end_ts,
        "limit": limit,
    }
    headers = {"Authorization": f"Bearer {TOKEN}"}
    resp = requests.get(
        f"{BASE_URL}/sdk/markets/{market_id}/pricing",
        params={k: v for k, v in params.items() if v is not None},
        headers=headers,
    )
    resp.raise_for_status()
    return resp.json()
A trimmed example JSON response:
{
  "data": [
    {
      "t": 1700000000,
      "o": 0.61,
      "h": 0.65,
      "l": 0.59,
      "c": 0.63,
      "v": 4200.5,
      "market_id": "abc123",
      "outcome_id": "yes",
      "payoutClose": null
    }
  ],
  "next_cursor": "eyJ0IjoxNzAwMDg2NDAwfQ=="
}
Key parameter semantics:
interval: enum string (1m,5m,15m,1h,1d). Defaults vary by provider; always specify explicitly.start_ts/end_ts: Unix timestamps in seconds (UTC). Omittingend_tsreturns up to the most recent finalized candle.limit: maximum candles per page. Paginate using thenext_cursorvalue returned in each response.outcome_id/token_id: the specific outcome within a multi-outcome market (e.g., “yes” vs. “no” for a binary market).
Pro Tip: For bulk historical pulls, set limit to the maximum allowed value and implement exponential backoff on 429 responses. Cache the next_cursor to disk after each page so a failed run resumes without re-fetching already-retrieved candles.
Rate limits on most prediction market APIs sit in the range of tens to hundreds of requests per minute for authenticated users. Check the Retry-After header on 429 responses and respect it. For the real-time Kalshi and Polymarket data use case, prefer streaming endpoints over repeated REST polling to reduce both latency and request count.
What intervals and schema fields should you expect?
Supported intervals typically include 1m, 5m, 15m, 1h, and 1d. Some providers also expose 3m and 30m. Bucket alignment follows UTC boundaries: a 1h candle starting at 14:00 UTC closes at 14:59:59 UTC, and the next opens at 15:00:00 UTC.
Interval | Bucket alignment | Typical use case |
|---|---|---|
1m | UTC minute boundary | Intraday signal research, thin-market monitoring |
5m | UTC 5-minute boundary | Short-term momentum signals |
15m | UTC 15-minute boundary | Standard backtesting resolution |
1h | UTC hour boundary | Swing signals, daily pattern detection |
1d | UTC midnight boundary | Calibration, long-horizon backtests |
The canonical schema fields are:
t: bucket open timestamp (Unix seconds, UTC)o,h,l,c: open, high, low, close probabilities (0–1)v: volume (traded probability quantity, taker-side)market_id: venue-agnostic market identifieroutcome_id: specific outcome within the marketpayoutOpen,payoutClose,payoutHigh,payoutLow,payoutMid: payout-adjusted fields for resolved markets (null for active markets)
The t field always represents the start of the bucket, not the end. When you join candle data from multiple venues, confirm this convention holds for each source before merging. A mismatch between “bucket start” and “bucket end” timestamp conventions will shift your entire time series by one interval and corrupt any event-time alignment you build on top of it.
Pro Tip: Normalize all timestamps to UTC immediately on ingestion. Store them as integer Unix seconds in your database, and convert to local time only at the display layer. Never store timezone-aware strings in your candle table.
Still-forming candles (the current, not-yet-closed bucket) are returned by most APIs with a flag or by convention as the last element in the response. Treat them as provisional: do not use them as signal inputs in live strategies until the bucket finalizes, and never persist them as final in your historical store.
How do you compute OHLCV from raw trade streams?
If you must build candles from raw trades rather than consuming precomputed ones, the pseudocode below covers the core aggregation loop and the most common edge cases.
from collections import defaultdict

def compute_candles(trades, interval_seconds):
    buckets = defaultdict(lambda: {"o": None, "h": -inf, "l": inf, "c": None, "v": 0.0})

    for trade in sorted(trades, key=lambda t: t["timestamp"]):
        bucket_ts = (trade["timestamp"] // interval_seconds) * interval_seconds
        b = buckets[bucket_ts]
        price = trade["price"]   # probability 0–1
        size  = trade["size"]    # taker fill quantity

        if b["o"] is None:
            b["o"] = price
        b["h"] = max(b["h"], price)
        b["l"] = min(b["l"], price)
        b["c"] = price
        b["v"] += size

    return [{"t": ts, **fields} for ts, fields in sorted(buckets.items())]
The implementation steps in production order:
Sort by timestamp before bucketing. Out-of-order delivery is common on on-chain sources.
Assign to bucket using integer division:
bucket_ts = (ts // interval_s) * interval_s.Aggregate open (first price), high (max), low (min), close (last price), volume (sum of sizes).
Watermark late trades. Set a watermark at
max_seen_ts - grace_period. Any trade withtimestamp < watermarkthat arrives after finalization triggers a backfill rewrite, not a new bucket assignment.Finalize and persist completed buckets to Parquet or a columnar store. Mark in-flight buckets with an
is_final = falseflag.
Volume in probability markets is the sum of taker fill sizes in probability units. Do not convert to dollar notional unless you are explicitly building a dollar-volume overlay. Mixing units silently is the most common volume bug.
For storage, Parquet with Snappy compression and partitioning by (venue, market_id, interval, date) gives efficient range scans for backtests. The prediction-market-analysis framework uses this exact layout with resumable indexers and checkpointing.
Pro Tip: Generate a set of synthetic trades with known OHLCV output and run your aggregation function against them as a unit test. Then fetch the same time range from a precomputed API and compare checksums. Any divergence reveals an inclusion-rule bug before it reaches production.
How do you backtest strategies using prediction market OHLCV?
Use the close price at candle end as the observable probability for signal inputs and scoring. Mid-candle sampling introduces lookahead bias because the high and low within a candle are not observable at the candle’s open. Sample the close, not the mid.
The Brier score is the standard calibration metric for prediction market strategies. For a set of predictions $p_i$ against binary outcomes $o_i \in {0, 1}$:
$$BS = \frac{1}{N} \sum_{i=1}^{N} (p_i - o_i)^2$$
Lower is better. A score of 0.25 corresponds to random guessing on a 50/50 market. A cross-market analysis of 3,587 markets spanning June 2021 through November 2025 demonstrates how calibration curves and volume breakdowns across markets provide the aggregated metrics needed to evaluate backtest plausibility, including pricing accuracy and liquidity signals.
To compute the Brier score against resolved outcomes using candle data:
Align each prediction to the candle close at the signal time (use
t + interval_secondsas the observation timestamp).Join to the resolved outcome using
payoutClose(1.0 for “yes” resolution, 0.0 for “no”).Compute
(close - payoutClose)^2per candle and average across the evaluation window.
Backtest checklist:
Fill-forward gaps: Markets with no trades in an interval produce no candle. Fill forward the last known close for signal continuity, but zero out volume for that bucket.
Resolution-event handling: Exclude candles after the
payoutClosefield becomes non-null from your signal generation window. Post-resolution candles have no predictive content.Event-time vs. wall-clock sampling: Use candle
t(bucket open timestamp) as the event time for all joins. Never use ingestion time or API response time.Volume weighting: Weight signal observations by volume to reduce noise from thin-liquidity candles. A candle with
v < thresholdis a weak signal regardless of its close value.
For a 15-minute intraday signal, fetch candles at interval=15m, compute your signal on the close series, and assume execution at the open of the next candle. That one-candle lag is the minimum realistic execution assumption for a non-HFT strategy. The backtesting walkthrough on Assymetrix covers sampling, weighting, and calibration in detail.
Pairing OHLCV with the Brier score tells you whether a strategy captures genuine predictive alpha or just tracks public polling shifts. Volume-weighted Brier scores are more informative than unweighted ones for thinly traded markets.
What are the most common OHLCV pitfalls and how do you fix them?
Run automated data-quality checks on every candle batch before it enters your signal pipeline. The failure modes below are ordered by how often they appear in production.
Validation checklist:
Timestamp monotonicity:
t[i+1] == t[i] + interval_secondsfor every consecutive pair. Any gap signals a missing candle.Probability bounds:
0 <= o, h, l, c <= 1for every row. A value outside this range indicates a unit mismatch (percentage vs. decimal).OHLC consistency:
l <= o, c <= handl <= h. Violations indicate aggregation bugs.No-op candles:
o == h == l == cwithv == 0is a fill-forward artifact, not a real candle. Flag these separately.Volume threshold: Alert when
v < min_volume_thresholdfor more than N consecutive candles. Sustained zero-volume periods often mean the market is stale or the feed has dropped.Payout sanity: For resolved markets,
payoutClosemust be 0.0 or 1.0 for binary outcomes. A value outside that range is a data error.
Alert conditions and mitigations:
Gap detected (missing candle): request a backfill for the missing range, then mark the affected candles as
backfilled = truein your store.Probability out of bounds: quarantine the candle, log the raw event, and request the source record for manual inspection.
Volume spike (> 10x rolling average): flag for review but do not discard. Large volume spikes around news events are real.
Unfinalized candle persisted as final: set
is_final = falseon the current bucket and re-fetch after the interval closes.
Reconciling REST historical pulls against streaming snapshots requires a two-pass approach: fetch the historical range via REST, then apply streaming deltas for the current day. Where they overlap, prefer the REST-sourced candle as the authoritative record and treat the streaming candle as provisional until the bucket closes.
How does Assymetrix deliver production-ready OHLCV data?
Assymetrix delivers precomputed, normalized OHLCV candles for Polymarket, Kalshi, and Limitless through the /sdk/markets/:id/pricing endpoint. The schema follows the canonical field names (t, o, h, l, c, v, market_id, outcome_id) with payoutClose and related payout fields populated for resolved markets. No post-processing is required before passing the response to a charting library.
The platform is built on extensive historical data spanning a large number of rows of trading activity, with hundreds of millions of price snapshots at 15-minute resolution. That depth supports multi-year backtests across all three venues without gaps in the major markets.
Metric | Assymetrix coverage |
|---|---|
Venues | Polymarket, Kalshi, Limitless |
Historical depth | Multi-year (venue launch to present) |
Snapshot volume | 200M+ at 15-minute resolution |
Supported intervals | 1m, 5m, 15m, 1h, 1d |
Schema | Unified (canonical field names, UTC timestamps) |
Payout fields | payoutOpen, payoutClose, payoutHigh, payoutLow, payoutMid |
Integration options beyond the REST endpoint include CSV and Parquet bulk exports for teams that prefer offline analysis, and a streaming layer for live candle updates. The Python developer guide covers SDK installation, authentication, and sample ingestion patterns. For teams building AI agents that consume live probability feeds, the AI agent integration guide covers the same endpoint in an autonomous execution context.
The unified schema handles cross-venue normalization automatically. Venue-specific identifiers are mapped to canonical market_id and outcome_id values, probability scaling is standardized to 0–1, and timezone alignment is enforced at ingestion. You do not need to write venue-specific parsing logic.
Which open-source libraries help with candlestick detection and validation?
For Python developers, CandleKit provides multi-candle pattern detectors with a pandas-friendly API, built-in demo OHLCV generators, and plotting utilities for annotating detected patterns. Feed it a DataFrame with lowercase column names (open, high, low, close, volume) and UTC-indexed timestamps and it integrates without field renaming.
The klineR package on CRAN exposes demo_ohlcv() generators and a pattern catalog with plotting helpers, making it practical for R-based quant workflows and for generating synthetic test data with known pattern outputs.
For JavaScript and TypeScript environments, the OHLC_Candlestick_Patterns library implements a streaming detection API with TypeScript packaging, useful for large-scale pattern scans in server-side Node.js pipelines or browser-based charting dashboards.
Integration tips:
Map Assymetrix field names (
o,h,l,c,v) to the library’s expected column names at the adapter layer, not inside your core pipeline.Use the library’s synthetic data generators to build unit tests with known pattern outputs before running against live candle data.
Annotate resolution events on charts using a vertical line or marker at the candle where
payoutClosebecomes non-null. Preserve payout markers so analysts can visually separate the trading period from the resolved state.
Pro Tip: Add candlestick pattern detection to your CI pipeline using synthetic OHLCV fixtures. A deterministic replay of known patterns catches regressions in your detection logic before they reach production dashboards.
An engineering perspective on running OHLCV pipelines at scale
The failure mode that costs the most time in production is not the aggregation logic. It is the silent gap: a market goes quiet for six hours, your pipeline produces no candles for that window, and your backtest fill-forward logic propagates a stale close into a signal that fires on the next active candle. The signal looks real. The trade looks plausible. The Brier score looks fine. But the input was six hours old.
The fix is a monitoring layer that distinguishes between “no trades in this interval” (a legitimate sparse candle) and “the feed stopped delivering” (a pipeline failure). Emit a heartbeat metric for every interval boundary, even when no candle is produced. Alert when heartbeats stop, not when candles stop. Checkpoint your watermark position to durable storage after every batch so a restart resumes from the last confirmed position rather than re-fetching the entire history.
Assymetrix: your unified source for prediction market candle data
The Prediction Market Data Feed API Guide is the fastest path from zero to a working OHLCV integration. It covers authentication, endpoint parameters, rate limits, and pagination for the /sdk/markets/:id/pricing endpoint across all three supported venues.
Assymetrix gives developers and quant researchers a single integration point for normalized, production-ready candle data across Polymarket, Kalshi, and Limitless, backed by 200M+ price snapshots and nearly one billion rows of historical trading activity. The schema is unified, the timestamps are UTC-aligned, and payout fields for resolved markets are included out of the box. No venue-specific parsing, no reconstruction logic, no timezone gymnastics. Start with the developer API guide to get your first candle response in under ten minutes, or access the full data platform at Data to explore historical coverage and bulk export options.
Sources
FAQ
What does OHLCV mean in a prediction market context?
Open, high, low, close, and volume represent implied probabilities (0–1) and traded probability quantity rather than asset prices or share counts. The Y-axis on a prediction market candlestick chart is a probability axis capped at 1.0.
How far back does historical OHLCV data go for Polymarket and Kalshi?
Polymarket data is available back to the venue’s 2020 launch for major markets; Kalshi’s regulated history starts from its 2021 launch. Assymetrix aggregates both into a unified historical store with 200M+ price snapshots at 15-minute resolution.
What is the Brier score and how do you compute it from candle data?
The Brier score is the mean squared error between predicted probabilities and binary outcomes: BS = mean((close - payoutClose)^2). Align each candle close to its resolved outcome using the payoutClose field and average across the evaluation window.
How do you handle missing candles caused by low liquidity?
Fill forward the last known close for signal continuity and set volume to zero for the empty bucket. Flag these fill-forward candles separately and exclude them from volume-weighted signal calculations.
Which intervals does the Assymetrix OHLCV endpoint support?
The /sdk/markets/:id/pricing endpoint supports 1m, 5m, 15m, 1h, and 1d intervals. All buckets align to UTC boundaries. Specify the interval explicitly in every request; do not rely on provider defaults.
Other Blog


