Prediction Market Microstructure: What the Data Reveals
Prediction Market Microstructure: What the Data Reveals
Prediction Market Microstructure: What the Data Reveals
Discover how prediction market microstructure reveals key insights. Learn about optimism taxes, forecasting errors, and data findings that matter.

Prediction Market Microstructure: What the Data Reveals
Cross-venue tick- and orderbook-level data reveal three structural facts that should anchor every quant’s prior: makers systematically capture an optimism tax from takers, the favorite–longshot bias concentrates in taker-initiated flow, and truth-aligned microstructure metrics predict forecasting errors in ways that heuristic classifiers cannot. These are not artifacts of a single venue or sample period. They replicate across centralized and on-chain markets, across category types, and across sample windows spanning tens of millions to over one billion trades.
The empirical foundation is substantial:
The Polymarket-v1 Database archives 1.20 billion trade records across 1.30 million markets, representing $61 billion in nominal volume, with ground-truth aggressor direction derived from on-chain OrderFilled events.
Kalshi transaction-level data analyzed by Becker covers 72.1 million trades and $18.26 billion in volume, with explicit maker/taker identification available through the API.
Key measurement finding: Standard tick-rule and bulk-volume classifiers achieve only approximately 49.8%–50.5% accuracy against on-chain ground truth on Polymarket, essentially random. Even the best public-feed heuristics reach only about 59% accuracy. Every VPIN estimate, order-flow imbalance calculation, and TCA result built on inferred direction carries that error forward.
Three immediate implications follow. First, measurement choices are not cosmetic: using inferred rather than truth-aligned direction corrupts VPIN, Kyle’s lambda, and maker/taker decompositions in ways that cannot be corrected post hoc. Second, makers often earn a structural spread premium that reflects taker behavioral biases rather than superior forecasting skill. Third, venue choice determines what you can measure: Polymarket’s on-chain settlement enables wallet-level traceability and ground-truth direction, while Kalshi’s centralized matching provides explicit role tags but anonymizes wallet identity.
Key Takeaways
Prediction market microstructure data consistently reveal maker/taker asymmetries, a favorite–longshot bias concentrated in taker flow, and truth-aligned metrics that predict forecasting errors, making measurement quality the primary determinant of research validity.
Point | Details |
|---|---|
Measurement quality is foundational | Standard heuristics achieve only 49.8%–50.5% direction accuracy; always join to on-chain OrderFilled events for truth-aligned metrics. |
Makers capture a structural premium | Taker losses concentrate at low-price longshots, funding maker returns through an optimism tax rather than superior forecasting skill. |
Venue choice determines what you can measure | Kalshi provides explicit role tags; Polymarket provides wallet-level traceability. Cross-venue work requires both. |
Microstructure predicts forecast accuracy | True VPIN positively predicts Brier score errors; Gibbs spread negatively predicts them, reflecting a selection effect in high-spread niche markets. |
Assymetrix for replication | The Assymetrix Data API provides 900M+ indexed on-chain events, truth-aligned trade fills, and Smart Money wallet tags across Polymarket, Kalshi, and Limitless. |
Table of Contents
What does prediction market microstructure data actually require?
What stylized facts does the data consistently show?
How do you decompose maker and taker returns?
How do you measure spreads, depth, and price impact in binary markets?
Kalshi vs. Polymarket: what each venue lets you measure
How does microstructure affect forecast accuracy and trading strategy?
What open resources exist for replicating these analyses?
How does the Assymetrix Data API support microstructure research?
What are the limits of current microstructure data, and what comes next?
Where should quant microstructure research go next?
Assymetrix gives you the data infrastructure to run this research
Sources
What does prediction market microstructure data actually require?
Prediction market microstructure analysis begins with a data architecture problem that has no clean analog in equity research. There is no consolidated tape. There is no NBBO. The authoritative record is split between off-chain order-book feeds and on-chain settlement logs, and joining them correctly is the single most consequential methodological decision you will make.
Primary data sources and required fields
A complete microstructure archive requires four event streams, each with distinct fields:
Event type | Required fields |
|---|---|
Order-add | event_id, market_id, side (YES/NO), price, size, timestamp_ns, wallet_id (Polymarket) or account_id (Kalshi), order_type (limit/market) |
Order-cancel | event_id, original_order_id, market_id, cancel_reason, timestamp_ns |
Trade-fill | trade_id, aggressor_order_id, passive_order_id, price, size, timestamp_ns, on-chain tx_hash (Polymarket) |
Settlement | market_id, outcome, resolution_source, resolution_timestamp, payout_per_share |
For Polymarket, the on-chain OrderFilled event is the authoritative fill record. The public WebSocket feed delivers order-book snapshots and trade notifications, but aggressor direction in that feed is inferred, not recorded. The join key is tx_hash: match each WebSocket trade notification to its on-chain OrderFilled event using the transaction hash, then read aggressor direction directly from the chain. The Polymarket-v1 replication package implements this join and is the reference implementation for truth-aligned direction.
For Kalshi, the transaction-level API provides explicit maker/taker tags per trade. Research using this API confirms that role identification is reliable and enables Mincer-Zarnowitz style forecast evaluation split by role. No on-chain join is required, but wallet-level identity is not available.
Sampling windows and cleaning
Typical sample windows in published work span 30–90 days of continuous tick capture for Polymarket (the Anatomy paper uses 52 days and 30 billion events) and multi-year transaction logs for Kalshi. Cleaning steps that matter:
Chain reorgs: flag and re-ingest any block that is reorganized within the first six confirmations; reorg-affected fills carry incorrect timestamps.
Partial fills: aggregate partial fills sharing the same aggressor order into a single logical trade before computing effective spread.
Ingestion delay: the gap between on-chain block time and WebSocket delivery averages several hundred milliseconds on congested networks. Use canonical block timestamps, not ingestion wall-clock time, as the authoritative event time for any TCA that crosses the on-chain/off-chain boundary.
Market selection: exclude markets that never attract a resting limit order on both sides; they contribute no spread or depth observations and distort depth-concentration statistics.
Pro Tip: Set a canonical clock before any join. Ingest on-chain logs first, assign block timestamps as the authoritative timeline, then align WebSocket events to the nearest preceding block. This eliminates the ambiguity of wall-clock ingestion delays and makes your TCA exactly reproducible. Document the block height range and the chain RPC endpoint used so a replicator can reconstruct the identical event sequence.
Reproducibility checklist
For any microstructure study to be replicable, the following must be fixed and documented: the exact block range or API date range used, the random seed for any subsampling, the deduplication logic for partial fills, the join key between off-chain and on-chain records, and the fee schedule applied in net-return calculations. Releasing these alongside a notebook is the minimum bar for a result that can be challenged or extended.
What stylized facts does the data consistently show?
Six empirical regularities appear across both Polymarket and Kalshi samples with enough consistency to treat as priors for model design and strategy construction.
Measurement note: Facts 1–3 are robust to classification proxies. Facts 4–6 require truth-aligned direction data; they degrade or reverse under heuristic classifiers.
Fact 1: Favorite–longshot bias. Low-probability contracts (longshots) are systematically overpriced relative to their resolution frequency. This is documented in both Kalshi transaction data and Polymarket archives. The bias is concentrated in taker-initiated flow: takers buy longshots at prices above actuarial value more often than makers post them.
Fact 2: Longshot spread premium. Quoted and effective spreads are wider at low-probability price levels than at mid-market. The Anatomy paper documents this as one of eight stylized facts in the Polymarket order book. Wider spreads at the tails reflect both inventory risk and adverse selection from informed traders who concentrate activity near resolution.
Fact 3: Maker/taker return asymmetry. Makers earn a small positive structural return; takers pay a structural premium. The Becker analysis characterizes this as a wealth transfer: takers’ losses at longshot prices fund maker returns, consistent with an optimism tax rather than superior maker forecasting skill.
Fact 4: Trade-direction autocorrelation. Aggressor-side trades cluster in time. A YES-buy is more likely to be followed by another YES-buy within a short window than chance alone predicts. This autocorrelation is detectable only with truth-aligned direction; heuristic classifiers introduce enough noise to suppress it.
Fact 5: Depth concentration. Resting liquidity concentrates in a small fraction of wallets on Polymarket.
Fact 6: Late-resolution liquidity collapse. Quoted depth falls sharply in the hours before resolution as informed traders withdraw resting orders. Effective spreads widen. This pattern is consistent with adverse-selection models where the probability of trading against a resolution-informed counterparty rises as the event approaches.
Stylized fact | Metric | Direction | Venue robustness |
|---|---|---|---|
Favorite–longshot bias | Calibration curve slope | Longshots overpriced | Both Kalshi and Polymarket |
Longshot spread premium | Quoted spread by price bin | Wider at tails | Polymarket (truth-aligned) |
Maker/taker return asymmetry | Role-level excess return | Makers positive, takers negative | Kalshi (explicit tags) |
Trade-direction autocorrelation | Autocorrelation of aggressor side | Positive, short-lag | Polymarket (on-chain only) |
Depth concentration | Gini of maker wallet depth | High concentration | Polymarket |
Late-resolution liquidity collapse | Depth and spread near resolution | Depth falls, spread widens | Both venues |
Category variation and selection effects
Sports and entertainment markets show narrower calibration errors than finance and political markets in several samples. The Polymarket-v1 analysis documents a counterintuitive selection effect: markets with wider Gibbs spreads tend to show lower Brier score errors. The mechanism is selection: high-spread niche markets attract specialist informed traders who price the contract accurately, while low-spread liquid markets attract noise flow that degrades calibration. This means spread is not a simple proxy for inefficiency in prediction markets. It is a venue-specific signal that requires context.
How do you decompose maker and taker returns?
The maker/taker decomposition is the most policy-relevant calculation in prediction market microstructure because it separates structural spread capture from forecasting skill. Getting it wrong produces the wrong conclusion about where alpha lives.
Role identification by venue
On Kalshi, the API returns a side field and a role field (maker or taker) for every transaction. Role assignment is unambiguous. On Polymarket, role must be inferred from the on-chain OrderFilled event: the aggressor is the wallet whose order was submitted last and crossed the spread; the passive side is the resting limit order. The tx_hash join described in the methodology section is the only reliable way to assign roles.
Computing role-level excess returns
Computation step | Maker | Taker |
|---|---|---|
Raw P&L per trade | (Resolution price – entry price) × size | (Resolution price – entry price) × size |
Fee adjustment | Subtract maker rebate (if any) or add maker fee | Subtract taker fee |
Price-bin grouping | Group by entry price in 5-cent bins (0–5¢, 5–15¢, …) | Same binning |
Excess return | Raw P&L minus expected value at entry price | Same |
Aggregation | Dollar-weighted mean excess return per bin | Dollar-weighted mean excess return per bin |
Dollar-weighting matters here. Equal-weighting inflates the contribution of small trades and obscures the wealth-transfer magnitude. The Becker analysis uses dollar-weighted returns to show that taker losses at low-price longshot bins are the primary source of maker gains, not maker outperformance at mid-market prices.
Pro Tip: Run the decomposition separately for contracts that resolve YES and contracts that resolve NO. Taker losses at longshot prices are asymmetric: takers who buy low-probability YES contracts that resolve NO lose their full entry price; takers who buy high-probability YES contracts that resolve YES earn near-par. Splitting by resolution outcome isolates the optimism tax from the actuarial return.
What the patterns show
Taker losses concentrate at entry prices below 20 cents. Maker returns are positive but small across most price bins, consistent with spread capture rather than forecasting edge. Symmetry tests using the UCD working paper framework confirm that maker/taker asymmetries are better explained by fees and behavioral taker-side biases than by differential information. This has a direct strategy implication: liquidity provision with disciplined position limits is a structurally positive-expectation activity, but it requires careful adverse-selection management near resolution.
Robustness checks to run: split by market category (sports vs. politics), split by time subsample (early vs. late in a market’s life), and re-run after adjusting for the fee schedule in effect during the sample period. Results that survive all three splits are structural; results that appear only in one category or one time window are likely selection artifacts.
How do you measure spreads, depth, and price impact in binary markets?
Standard equity microstructure formulas apply to prediction markets with modifications for the binary contract structure and the $1 payout unit. The key adjustments are price-bin normalization and the treatment of bounded share supply.
Metric definitions adapted for prediction markets
Quoted spread: QS = Ask – Bid, expressed in probability units (cents on a $1 contract). No normalization by mid-price is needed because the contract is already in probability space.
Effective spread: ES = 2 × |Trade price – Mid-quote at trade time|. Compute mid-quote from the best resting bid and ask at the nanosecond immediately preceding the trade timestamp. Use on-chain block timestamps, not WebSocket delivery time.
Gibbs spread: Estimated from the serial covariance of price changes using the Gibbs (1997) estimator. Preferred over Roll spread in prediction markets because it is less sensitive to the bid-ask bounce artifact that Roll assumes is the primary source of negative serial covariance. The Polymarket-v1 analysis recommends Gibbs spread over Roll spread for this reason.
True VPIN: Volume-synchronized probability of informed trading, computed using on-chain aggressor direction rather than bulk-volume classification. The Anatomy paper shows that True VPIN computed from on-chain direction predicts forecasting errors; BVC-VPIN computed from heuristic direction does not.
Kyle’s lambda: Estimated from the regression of mid-quote change on signed order flow (dollar volume × aggressor direction). In binary markets, normalize order flow by the contract’s maximum payout ($1) rather than by share price to make lambda comparable across markets at different price levels.
Pro Tip: Depth normalization is non-trivial when share supply is bounded. On Polymarket, total YES shares outstanding equals total NO shares outstanding by construction. Comparing depth in dollar terms across markets at different price levels requires dividing resting depth by the market’s current mid-price to get a probability-normalized depth measure. Without this adjustment, a market trading at 90 cents looks ten times deeper than an identical market trading at 9 cents, even if both have the same number of shares resting.
Building a price-impact model for execution
A minimal execution model for a prediction market algo needs three inputs: the current quoted spread, the depth at each price level within two ticks of mid, and an estimate of Kyle’s lambda from the prior 24 hours of on-chain flow. Given those inputs, the expected cost of a market order of size Q is approximately ES/2 + lambda × Q. Markets where this cost exceeds the expected edge of a signal should be skipped or worked as limit orders. This framework applies directly to TCA for prediction market execution algos.
Kalshi vs. Polymarket: what each venue lets you measure
The structural differences between Kalshi and Polymarket are not just regulatory footnotes. They determine which microstructure questions you can answer with confidence and which require approximation.
Kalshi operates as a CFTC-regulated designated contract market. Contracts carry fixed $1 payouts, defined resolution sources, and centralized clearing. The API provides explicit maker/taker tags, fee schedules, and settlement timestamps. What it does not provide is wallet-level identity: accounts are anonymized, so you cannot track a specific trader’s activity across markets or link trading behavior to on-chain wallet history.
Polymarket settles on-chain. Every fill is a blockchain transaction. Every wallet is a public address. This means you can reconstruct the complete trading history of any wallet, link positions across markets, and identify Smart Money wallets by their historical accuracy. The cost is operational: you must maintain an on-chain event archive, handle reorgs, and perform the tx_hash join to get ground-truth direction.
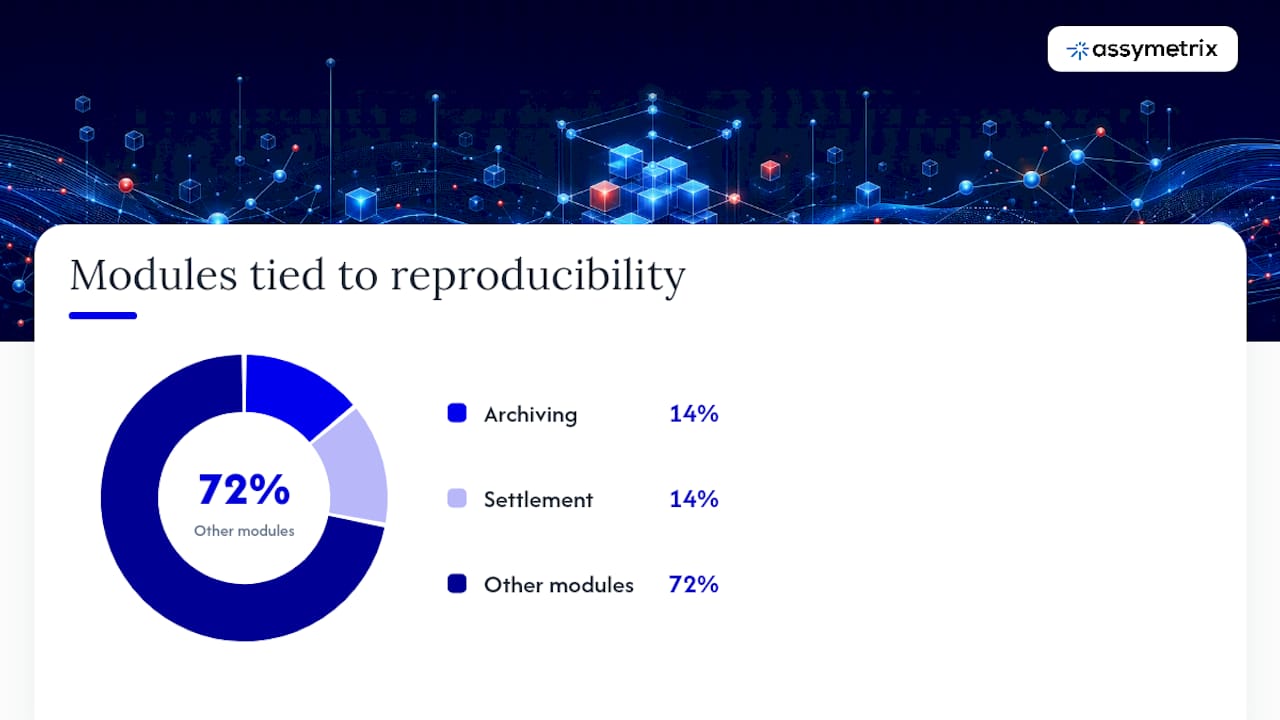
The SoK on decentralized prediction markets frames this as a trade-off across seven design modules: infrastructure, market topic, share structure, trading mechanism, resolution, settlement, and archiving. Archiving and settlement are the two modules most consequential for reproducibility. On-chain settlement makes archiving deterministic; centralized settlement requires trusting the venue’s API to be complete and unrevised.
Kalshi advantages:
Explicit maker/taker role tags eliminate the direction-inference problem for role decomposition.
Regulatory oversight under CFTC provides contract standardization and resolution-source transparency.
Lower operational complexity: no on-chain join required.
Kalshi limitations:
No wallet-level traceability: Smart Money tracking is not possible.
Centralized matching means the order-book event log is a vendor-provided feed, not a trustless archive.
Settlement latency is defined by the venue’s internal process, not a public blockchain.
Polymarket advantages:
On-chain settlement provides ground-truth aggressor direction via OrderFilled events.
Wallet-level traceability enables Smart Money identification, cross-market position tracking, and informed-trader detection.
Archiving is trustless: any node can reconstruct the full event history from the chain.
Polymarket limitations:
Requires on-chain join for truth-aligned direction; public WebSocket feeds alone achieve only approximately 59% direction accuracy.
Chain reorgs and ingestion delays add operational complexity.
No explicit maker/taker tags in the WebSocket feed; role must be inferred from the OrderFilled event structure.
Dimension | Kalshi | Polymarket |
|---|---|---|
Venue type | Centralized, CFTC-regulated DCM | On-chain, decentralized settlement |
Quoted spread | Available via API snapshots | Available via WebSocket order book |
Role observability | Explicit maker/taker tags in API | Requires on-chain OrderFilled join |
Wallet traceability | Anonymized accounts | Full public wallet history |
Settlement latency | Venue-defined, hours to days | On-chain finality, minutes to hours |
Ground-truth direction | Not applicable (explicit tags) | On-chain OrderFilled event |
Forecast accuracy (Brier) | Measurable with role splits | Measurable with wallet-level splits |
For a research question about role-based return decomposition, Kalshi’s explicit tags make it the cleaner venue. For a question about informed-trader identification, Smart Money concentration, or wallet-level adverse selection, Polymarket’s on-chain architecture is the only option. Cross-venue work combining both, normalized through a unified data layer, is where the most complete picture emerges.
How does microstructure affect forecast accuracy and trading strategy?
The connection between microstructure quality and forecasting performance is not intuitive, but the data are consistent. True VPIN positively predicts Brier score errors: markets with higher informed-trading probability produce worse aggregate forecasts, likely because noise flow dominates price discovery in those markets. Gibbs spread negatively predicts Brier score errors: wider-spread markets tend to attract specialist informed traders who price the contract accurately.

This has a direct implication for model builders who use market prices as training labels. A price from a high-VPIN, low-spread market is a noisier label than a price from a low-VPIN, high-spread market. Weighting training examples by inverse VPIN, or filtering to markets where Gibbs spread exceeds a threshold, should improve label quality for any model trained on market-implied probabilities.
Execution implications
Spread and depth profiles determine when maker strategies dominate taker strategies. In markets where the quoted spread exceeds twice the expected edge of a signal, crossing the spread destroys the signal’s value. The correct response is to post a limit order and wait for the spread to come to you, accepting the risk of non-execution. In markets where depth is thin and VPIN is elevated, even limit orders face adverse selection: the counterparty who fills your resting order near resolution is more likely to be informed than at mid-market.
A practical execution framework:
Post limit orders in markets where quoted spread exceeds 3 cents and depth within two ticks of mid exceeds $500 in dollar terms.
Cross the spread only when the signal’s expected value exceeds the effective spread by a factor of at least 1.5.
Withdraw resting orders in the final two hours before resolution in markets where VPIN has risen above its 90th percentile for that market’s history.
For cross-venue arbitrage, compute expected capture net of both venues’ fees and the settlement latency differential before sizing the position.
Pro Tip: Combine wallet-level Smart Money signals with spread and depth filters before routing orders to automated agents. A Smart Money wallet’s position in a market is a stronger signal when that market also shows low VPIN and moderate spread, indicating that the informed trader’s edge is not already fully reflected in the price. High-VPIN markets with Smart Money activity often mean the information is already in the book.
Cross-venue arbitrage constraints
Settlement latency is the binding constraint on cross-venue arbitrage between Kalshi and Polymarket on correlated events. Kalshi settlement is centralized and may take hours; Polymarket settlement requires on-chain finality. A position opened to capture a price divergence between the two venues carries the risk that one venue resolves before the other, leaving a one-sided exposure. Sizing cross-venue positions to account for this asymmetric resolution risk, and monitoring the arbitrage signal in real time, is necessary for any systematic cross-venue strategy.
What open resources exist for replicating these analyses?
The replication infrastructure for prediction market microstructure is more developed than most quants expect. Three resources anchor the reproducible research ecosystem:
Polymarket-v1 Database (Arxiv): 1.20 billion trade records with ground-truth aggressor direction. The dataset includes replication code for the tx_hash join and for computing True VPIN and Gibbs spread from on-chain events. This is the reference dataset for any study that claims truth-aligned direction on Polymarket.
Anatomy of a Decentralized Prediction Market replication package (Arxiv): code to join 30 billion orderbook events to on-chain fills over a 52-day panel, compute the eight stylized facts, and reproduce the maker-wallet concentration and spread-profile results.
Becker/Kalshi replication materials (Jbecker): the 72.1 million trade Kalshi dataset with maker/taker labels, role-level return tables, and the wealth-transfer decomposition.
Reproducibility checklist
Before running any microstructure notebook, confirm:
The exact block range (Polymarket) or API date range (Kalshi) is fixed and documented.
The random seed for any subsampling is set and logged.
Partial fills are aggregated before spread computation.
Fee schedules match the period of the sample.
The join between off-chain and on-chain records uses tx_hash, not timestamp proximity.
Validation tests for trade-direction accuracy are run against a held-out on-chain sample before any downstream metric is computed.
Sample notebook task sequence
A minimal replication notebook covers three tasks in order:
Join orderbook events to on-chain OrderFilled records using tx_hash; validate direction accuracy against the ground-truth label; report the fraction correctly classified.
Compute True VPIN using on-chain aggressor direction; bucket by 1% of daily volume; plot VPIN against time-to-resolution to observe the late-resolution spike.
Replicate the maker/taker return table by price bin; apply dollar-weighting; split by resolution outcome to isolate the optimism tax.
For Python-based implementation, the Assymetrix Python API guide provides step-by-step ingestion patterns that align with these notebook tasks.
How does the Assymetrix Data API support microstructure research?
Assymetrix provides the unified, truth-aligned cross-venue event archive that the analyses above require. The platform indexes over 900 million on-chain events, covers more than five years of historical data, and normalizes schemas across Polymarket, Kalshi, and Limitless into a single integration layer. The Data API exposes this archive through time-series endpoints, orderbook tick archives, and wallet activity joins.
For replication work: The Assymetrix API delivers the three event streams required for truth-aligned microstructure analysis: orderbook tick archives (order-add, order-cancel events with nanosecond timestamps), trade-fill records joined to on-chain OrderFilled events with ground-truth aggressor direction, and wallet activity logs with Smart Money tags and Trader Skill Scores pre-computed. A single API integration replaces the operational work of maintaining separate Polymarket node archives and Kalshi API polling pipelines.
API endpoint patterns for common tasks
The minimal call sequence for a VPIN computation on Polymarket:
Pull orderbook tick events for a market using the
/v1/orderbook/eventsendpoint, specifyingmarket_id,start_block, andend_block. The response includes order-add and order-cancel events with canonical block timestamps.Pull trade-fill records from
/v1/tradesfor the same market and block range. Each record includestx_hash,aggressor_side(derived from on-chain OrderFilled),price, andsize.Join the two streams on
market_idandtimestamp_nsto build the full event timeline. Bucket signed volume by aggressor side into VPIN buckets of 1% daily volume. Compute VPIN as the ratio of absolute order-flow imbalance to total bucket volume.
For Gibbs spread, pull the same orderbook event stream and compute the serial covariance of mid-quote changes across consecutive trade events. The API’s normalized price field (in probability units, 0–100 cents) eliminates the need for price-level normalization.
API endpoint | Data returned | Key parameters | Use case |
|---|---|---|---|
| Order-add, order-cancel events | market_id, start_block, end_block | Spread, depth, VPIN computation |
| Trade fills with on-chain direction | market_id, date_range, venue | Maker/taker decomposition, TCA |
| Wallet trade history, Smart Money tag | address, market_id | Informed-trader identification |
| Market metadata, resolution outcome | category, status, venue | Sample construction, settlement joins |
Integration tips
Use bulk export endpoints for backtesting: the API supports compressed NDJSON exports for date ranges exceeding 30 days, which are faster than paginated requests for large historical samples.
For live agents, the WebSocket streaming endpoint delivers orderbook updates with sub-second latency; pair it with the REST trade endpoint to validate direction on fills as they arrive.
Timestamps in all API responses use canonical block time (Unix nanoseconds) for on-chain events and ISO 8601 UTC for Kalshi events; convert to a common epoch before joining cross-venue streams.
Pagination uses cursor-based tokens; store the cursor at each checkpoint so a failed run can resume without re-ingesting earlier pages.
Pro Tip: Use Assymetrix Smart Money wallet tags and Trader Skill Scores to build a labeled training set for direction models. Filter historical trades to wallets with Trader Skill Scores in the top decile, then use their aggressor-side decisions as positive labels for a signal model. This produces a higher-quality label set than using resolution outcome alone, because skilled wallets tend to trade early when the information advantage is largest.
The cross-venue signal generation guide walks through how to combine Smart Money tags with spread and depth filters to build a prioritized signal queue for automated agents.
What are the limits of current microstructure data, and what comes next?
Three measurement problems remain unresolved and should be stated plainly before any result is presented as settled.
Representative limitation: Even the best public-feed heuristics achieve only approximately 59% direction accuracy against on-chain truth on Polymarket. For venues without on-chain settlement, no ground-truth benchmark exists at all. Every VPIN, OFI, and TCA result computed from inferred direction on such venues carries an unknown and potentially large classification error.
Limitation 1: Direction classification in non-on-chain venues. Kalshi’s explicit maker/taker tags solve the role-decomposition problem but do not provide aggressor direction in the sense used for VPIN or OFI. Venues that provide neither on-chain settlement nor explicit role tags leave researchers with heuristics that the Polymarket-v1 benchmark shows are near-random.
Limitation 2: Category heterogeneity and selection bias. Stylized facts estimated on pooled samples mix markets with very different information environments. Sports markets, political markets, and financial markets attract different trader populations and have different resolution-information structures. Pooled estimates may reflect category composition rather than universal microstructure laws.
Limitation 3: Survivorship in thin markets. Markets that never attract resting liquidity on both sides are typically excluded from spread and depth analyses. This exclusion biases depth and spread estimates upward: the markets you can measure are the ones that attracted enough participation to generate a two-sided book.
Open research questions
The most productive directions for the next wave of prediction market microstructure research:
Optimism tax dynamics: formally model how the taker-side bias evolves as a market approaches resolution and test whether the bias is stronger for markets with longer resolution horizons.
Microstructure-driven forecast weighting: test whether weighting market-implied probabilities by inverse True VPIN improves aggregate calibration in a held-out sample.
Order-flow causality: use the on-chain event sequence to test Granger causality between Smart Money wallet flow and subsequent mid-quote revision.
AMM vs. CLOB design trade-offs: the SoK framework identifies automated market maker designs as an alternative to central limit order books in decentralized prediction markets; a controlled comparison of spread, depth, and forecast accuracy across the two mechanisms would be a significant contribution.
Experimental designs worth pursuing: randomized maker incentive programs (varying rebate levels across matched market pairs), controlled liquidity injections to test depth resiliency, and time-based resolution tests that vary the announcement-to-resolution window to measure its effect on late-resolution liquidity collapse.
Where should quant microstructure research go next?
Three priorities stand out for researchers and traders who want to move from replication to original contribution.
Truth-aligned metrics first. The classifier accuracy finding is not a minor caveat. Near-random direction inference means that any study using heuristic classifiers on venues without on-chain truth is measuring noise. The field needs more studies that treat on-chain validation as a prerequisite, not an optional robustness check.
Wallet-tracking and TCA as standard tools. Equity microstructure has had transaction cost analysis as a standard institutional practice for decades. Prediction markets are only beginning to develop TCA frameworks that account for binary payouts, resolution-driven order flow, and the absence of a consolidated tape. Wallet-level tracking on Polymarket makes this possible in a way that has no equity analog.
Model complexity vs. measurement noise. The temptation in quant research is to add model complexity when results are noisy. In prediction market microstructure, the noise is often measurement error in direction classification, not model misspecification. Adding a second factor to a VPIN model built on 59%-accurate direction data does not improve the model; it fits the noise more precisely. The right response is to improve the measurement, not the model.
On ethics: wallet-level Smart Money analyses on Polymarket involve public blockchain data, but the individuals behind those wallets may not expect their trading behavior to be published in academic work. Standard practice in published research should include pseudonymization of wallet addresses, IRB review where the institution requires it for human-subjects data, and a disclosure policy that does not name individual traders without consent. The fact that the data is technically public does not settle the ethical question.
Assymetrix gives you the data infrastructure to run this research
Prediction market microstructure research stalls at the data layer. Maintaining separate Polymarket node archives, Kalshi API polling pipelines, and wallet-activity databases is months of engineering before the first spread estimate is computed.

Assymetrix removes that bottleneck. The platform’s unified cross-venue Data API delivers truth-aligned orderbook tick archives, on-chain trade fills with ground-truth aggressor direction, and wallet-level Smart Money tags across Polymarket, Kalshi, and Limitless through a single integration. The historical archive spans more than five years and over 900 million indexed on-chain events, normalized to a common schema so cross-venue spread and VPIN comparisons require no additional cleaning.
Prebuilt datasets available to subscribers include Polymarket truth-aligned orderbook joins, Kalshi maker/taker-labeled trade samples, and historical VPIN series by market category. For quant teams building execution algos or AI agents, the cross-venue signal guide shows how to combine Smart Money wallet tags with spread filters to build a prioritized signal queue. Start with the /v1/trades endpoint, pull a 30-day Polymarket sample with on-chain direction, and run the maker/taker return table by price bin. That first query reproduces the core wealth-transfer result from the Becker analysis in under an hour. Access the API at Data.
Sources
The following resources support the empirical claims and methods in this article:
This article is general information, not a substitute for advice from a qualified financial advisor. Consult a qualified financial professional about your own circumstances before acting on anything here.
FAQ
What is market microstructure data in prediction markets?
Market microstructure data in prediction markets includes tick-level order-book events (order-add, order-cancel, trade-fill), settlement records, and wallet activity logs. For on-chain venues like Polymarket, the authoritative source is the on-chain OrderFilled event, which provides ground-truth aggressor direction that public WebSocket feeds cannot reliably infer.
What do prediction markets actually predict?
Prediction markets aggregate traders’ probability estimates for specific future events by pricing binary contracts that pay $1 if the event occurs and $0 if it does not. The contract price reflects the market’s consensus probability, though microstructure factors like spread, VPIN, and maker/taker flow composition affect how accurately that price tracks the true probability.
What is the structure of a prediction market?
A prediction market consists of a central limit order book or automated market maker where traders post bids and offers on binary outcome contracts, a resolution mechanism tied to a defined information source, and a settlement process that pays winning contract holders. Regulated U.S. venues like Kalshi operate under CFTC oversight with fixed $1 payouts and defined resolution sources.
How does microstructure affect prediction market accuracy?
Markets with higher True VPIN (informed-trading probability) show systematically higher Brier score errors, while markets with wider Gibbs spreads tend to show lower forecasting errors due to a selection effect: high-spread niche markets attract specialist informed traders who price contracts accurately.
Which platforms provide the best data for microstructure research?
Polymarket provides on-chain ground-truth aggressor direction via OrderFilled events and wallet-level traceability, making it the reference venue for truth-aligned microstructure studies. Kalshi provides explicit maker/taker role tags through its API, enabling clean role decomposition without an on-chain join. Assymetrix aggregates both venues into a unified API with pre-joined truth-aligned trade records, Smart Money wallet tags, and historical VPIN series, reducing the data engineering required to replicate published results.
Prediction Market Microstructure: What the Data Reveals
Cross-venue tick- and orderbook-level data reveal three structural facts that should anchor every quant’s prior: makers systematically capture an optimism tax from takers, the favorite–longshot bias concentrates in taker-initiated flow, and truth-aligned microstructure metrics predict forecasting errors in ways that heuristic classifiers cannot. These are not artifacts of a single venue or sample period. They replicate across centralized and on-chain markets, across category types, and across sample windows spanning tens of millions to over one billion trades.
The empirical foundation is substantial:
The Polymarket-v1 Database archives 1.20 billion trade records across 1.30 million markets, representing $61 billion in nominal volume, with ground-truth aggressor direction derived from on-chain OrderFilled events.
Kalshi transaction-level data analyzed by Becker covers 72.1 million trades and $18.26 billion in volume, with explicit maker/taker identification available through the API.
Key measurement finding: Standard tick-rule and bulk-volume classifiers achieve only approximately 49.8%–50.5% accuracy against on-chain ground truth on Polymarket, essentially random. Even the best public-feed heuristics reach only about 59% accuracy. Every VPIN estimate, order-flow imbalance calculation, and TCA result built on inferred direction carries that error forward.
Three immediate implications follow. First, measurement choices are not cosmetic: using inferred rather than truth-aligned direction corrupts VPIN, Kyle’s lambda, and maker/taker decompositions in ways that cannot be corrected post hoc. Second, makers often earn a structural spread premium that reflects taker behavioral biases rather than superior forecasting skill. Third, venue choice determines what you can measure: Polymarket’s on-chain settlement enables wallet-level traceability and ground-truth direction, while Kalshi’s centralized matching provides explicit role tags but anonymizes wallet identity.
Key Takeaways
Prediction market microstructure data consistently reveal maker/taker asymmetries, a favorite–longshot bias concentrated in taker flow, and truth-aligned metrics that predict forecasting errors, making measurement quality the primary determinant of research validity.
Point | Details |
|---|---|
Measurement quality is foundational | Standard heuristics achieve only 49.8%–50.5% direction accuracy; always join to on-chain OrderFilled events for truth-aligned metrics. |
Makers capture a structural premium | Taker losses concentrate at low-price longshots, funding maker returns through an optimism tax rather than superior forecasting skill. |
Venue choice determines what you can measure | Kalshi provides explicit role tags; Polymarket provides wallet-level traceability. Cross-venue work requires both. |
Microstructure predicts forecast accuracy | True VPIN positively predicts Brier score errors; Gibbs spread negatively predicts them, reflecting a selection effect in high-spread niche markets. |
Assymetrix for replication | The Assymetrix Data API provides 900M+ indexed on-chain events, truth-aligned trade fills, and Smart Money wallet tags across Polymarket, Kalshi, and Limitless. |
Table of Contents
What does prediction market microstructure data actually require?
What stylized facts does the data consistently show?
How do you decompose maker and taker returns?
How do you measure spreads, depth, and price impact in binary markets?
Kalshi vs. Polymarket: what each venue lets you measure
How does microstructure affect forecast accuracy and trading strategy?
What open resources exist for replicating these analyses?
How does the Assymetrix Data API support microstructure research?
What are the limits of current microstructure data, and what comes next?
Where should quant microstructure research go next?
Assymetrix gives you the data infrastructure to run this research
Sources
What does prediction market microstructure data actually require?
Prediction market microstructure analysis begins with a data architecture problem that has no clean analog in equity research. There is no consolidated tape. There is no NBBO. The authoritative record is split between off-chain order-book feeds and on-chain settlement logs, and joining them correctly is the single most consequential methodological decision you will make.
Primary data sources and required fields
A complete microstructure archive requires four event streams, each with distinct fields:
Event type | Required fields |
|---|---|
Order-add | event_id, market_id, side (YES/NO), price, size, timestamp_ns, wallet_id (Polymarket) or account_id (Kalshi), order_type (limit/market) |
Order-cancel | event_id, original_order_id, market_id, cancel_reason, timestamp_ns |
Trade-fill | trade_id, aggressor_order_id, passive_order_id, price, size, timestamp_ns, on-chain tx_hash (Polymarket) |
Settlement | market_id, outcome, resolution_source, resolution_timestamp, payout_per_share |
For Polymarket, the on-chain OrderFilled event is the authoritative fill record. The public WebSocket feed delivers order-book snapshots and trade notifications, but aggressor direction in that feed is inferred, not recorded. The join key is tx_hash: match each WebSocket trade notification to its on-chain OrderFilled event using the transaction hash, then read aggressor direction directly from the chain. The Polymarket-v1 replication package implements this join and is the reference implementation for truth-aligned direction.
For Kalshi, the transaction-level API provides explicit maker/taker tags per trade. Research using this API confirms that role identification is reliable and enables Mincer-Zarnowitz style forecast evaluation split by role. No on-chain join is required, but wallet-level identity is not available.
Sampling windows and cleaning
Typical sample windows in published work span 30–90 days of continuous tick capture for Polymarket (the Anatomy paper uses 52 days and 30 billion events) and multi-year transaction logs for Kalshi. Cleaning steps that matter:
Chain reorgs: flag and re-ingest any block that is reorganized within the first six confirmations; reorg-affected fills carry incorrect timestamps.
Partial fills: aggregate partial fills sharing the same aggressor order into a single logical trade before computing effective spread.
Ingestion delay: the gap between on-chain block time and WebSocket delivery averages several hundred milliseconds on congested networks. Use canonical block timestamps, not ingestion wall-clock time, as the authoritative event time for any TCA that crosses the on-chain/off-chain boundary.
Market selection: exclude markets that never attract a resting limit order on both sides; they contribute no spread or depth observations and distort depth-concentration statistics.
Pro Tip: Set a canonical clock before any join. Ingest on-chain logs first, assign block timestamps as the authoritative timeline, then align WebSocket events to the nearest preceding block. This eliminates the ambiguity of wall-clock ingestion delays and makes your TCA exactly reproducible. Document the block height range and the chain RPC endpoint used so a replicator can reconstruct the identical event sequence.
Reproducibility checklist
For any microstructure study to be replicable, the following must be fixed and documented: the exact block range or API date range used, the random seed for any subsampling, the deduplication logic for partial fills, the join key between off-chain and on-chain records, and the fee schedule applied in net-return calculations. Releasing these alongside a notebook is the minimum bar for a result that can be challenged or extended.
What stylized facts does the data consistently show?
Six empirical regularities appear across both Polymarket and Kalshi samples with enough consistency to treat as priors for model design and strategy construction.
Measurement note: Facts 1–3 are robust to classification proxies. Facts 4–6 require truth-aligned direction data; they degrade or reverse under heuristic classifiers.
Fact 1: Favorite–longshot bias. Low-probability contracts (longshots) are systematically overpriced relative to their resolution frequency. This is documented in both Kalshi transaction data and Polymarket archives. The bias is concentrated in taker-initiated flow: takers buy longshots at prices above actuarial value more often than makers post them.
Fact 2: Longshot spread premium. Quoted and effective spreads are wider at low-probability price levels than at mid-market. The Anatomy paper documents this as one of eight stylized facts in the Polymarket order book. Wider spreads at the tails reflect both inventory risk and adverse selection from informed traders who concentrate activity near resolution.
Fact 3: Maker/taker return asymmetry. Makers earn a small positive structural return; takers pay a structural premium. The Becker analysis characterizes this as a wealth transfer: takers’ losses at longshot prices fund maker returns, consistent with an optimism tax rather than superior maker forecasting skill.
Fact 4: Trade-direction autocorrelation. Aggressor-side trades cluster in time. A YES-buy is more likely to be followed by another YES-buy within a short window than chance alone predicts. This autocorrelation is detectable only with truth-aligned direction; heuristic classifiers introduce enough noise to suppress it.
Fact 5: Depth concentration. Resting liquidity concentrates in a small fraction of wallets on Polymarket.
Fact 6: Late-resolution liquidity collapse. Quoted depth falls sharply in the hours before resolution as informed traders withdraw resting orders. Effective spreads widen. This pattern is consistent with adverse-selection models where the probability of trading against a resolution-informed counterparty rises as the event approaches.
Stylized fact | Metric | Direction | Venue robustness |
|---|---|---|---|
Favorite–longshot bias | Calibration curve slope | Longshots overpriced | Both Kalshi and Polymarket |
Longshot spread premium | Quoted spread by price bin | Wider at tails | Polymarket (truth-aligned) |
Maker/taker return asymmetry | Role-level excess return | Makers positive, takers negative | Kalshi (explicit tags) |
Trade-direction autocorrelation | Autocorrelation of aggressor side | Positive, short-lag | Polymarket (on-chain only) |
Depth concentration | Gini of maker wallet depth | High concentration | Polymarket |
Late-resolution liquidity collapse | Depth and spread near resolution | Depth falls, spread widens | Both venues |
Category variation and selection effects
Sports and entertainment markets show narrower calibration errors than finance and political markets in several samples. The Polymarket-v1 analysis documents a counterintuitive selection effect: markets with wider Gibbs spreads tend to show lower Brier score errors. The mechanism is selection: high-spread niche markets attract specialist informed traders who price the contract accurately, while low-spread liquid markets attract noise flow that degrades calibration. This means spread is not a simple proxy for inefficiency in prediction markets. It is a venue-specific signal that requires context.
How do you decompose maker and taker returns?
The maker/taker decomposition is the most policy-relevant calculation in prediction market microstructure because it separates structural spread capture from forecasting skill. Getting it wrong produces the wrong conclusion about where alpha lives.
Role identification by venue
On Kalshi, the API returns a side field and a role field (maker or taker) for every transaction. Role assignment is unambiguous. On Polymarket, role must be inferred from the on-chain OrderFilled event: the aggressor is the wallet whose order was submitted last and crossed the spread; the passive side is the resting limit order. The tx_hash join described in the methodology section is the only reliable way to assign roles.
Computing role-level excess returns
Computation step | Maker | Taker |
|---|---|---|
Raw P&L per trade | (Resolution price – entry price) × size | (Resolution price – entry price) × size |
Fee adjustment | Subtract maker rebate (if any) or add maker fee | Subtract taker fee |
Price-bin grouping | Group by entry price in 5-cent bins (0–5¢, 5–15¢, …) | Same binning |
Excess return | Raw P&L minus expected value at entry price | Same |
Aggregation | Dollar-weighted mean excess return per bin | Dollar-weighted mean excess return per bin |
Dollar-weighting matters here. Equal-weighting inflates the contribution of small trades and obscures the wealth-transfer magnitude. The Becker analysis uses dollar-weighted returns to show that taker losses at low-price longshot bins are the primary source of maker gains, not maker outperformance at mid-market prices.
Pro Tip: Run the decomposition separately for contracts that resolve YES and contracts that resolve NO. Taker losses at longshot prices are asymmetric: takers who buy low-probability YES contracts that resolve NO lose their full entry price; takers who buy high-probability YES contracts that resolve YES earn near-par. Splitting by resolution outcome isolates the optimism tax from the actuarial return.
What the patterns show
Taker losses concentrate at entry prices below 20 cents. Maker returns are positive but small across most price bins, consistent with spread capture rather than forecasting edge. Symmetry tests using the UCD working paper framework confirm that maker/taker asymmetries are better explained by fees and behavioral taker-side biases than by differential information. This has a direct strategy implication: liquidity provision with disciplined position limits is a structurally positive-expectation activity, but it requires careful adverse-selection management near resolution.
Robustness checks to run: split by market category (sports vs. politics), split by time subsample (early vs. late in a market’s life), and re-run after adjusting for the fee schedule in effect during the sample period. Results that survive all three splits are structural; results that appear only in one category or one time window are likely selection artifacts.
How do you measure spreads, depth, and price impact in binary markets?
Standard equity microstructure formulas apply to prediction markets with modifications for the binary contract structure and the $1 payout unit. The key adjustments are price-bin normalization and the treatment of bounded share supply.
Metric definitions adapted for prediction markets
Quoted spread: QS = Ask – Bid, expressed in probability units (cents on a $1 contract). No normalization by mid-price is needed because the contract is already in probability space.
Effective spread: ES = 2 × |Trade price – Mid-quote at trade time|. Compute mid-quote from the best resting bid and ask at the nanosecond immediately preceding the trade timestamp. Use on-chain block timestamps, not WebSocket delivery time.
Gibbs spread: Estimated from the serial covariance of price changes using the Gibbs (1997) estimator. Preferred over Roll spread in prediction markets because it is less sensitive to the bid-ask bounce artifact that Roll assumes is the primary source of negative serial covariance. The Polymarket-v1 analysis recommends Gibbs spread over Roll spread for this reason.
True VPIN: Volume-synchronized probability of informed trading, computed using on-chain aggressor direction rather than bulk-volume classification. The Anatomy paper shows that True VPIN computed from on-chain direction predicts forecasting errors; BVC-VPIN computed from heuristic direction does not.
Kyle’s lambda: Estimated from the regression of mid-quote change on signed order flow (dollar volume × aggressor direction). In binary markets, normalize order flow by the contract’s maximum payout ($1) rather than by share price to make lambda comparable across markets at different price levels.
Pro Tip: Depth normalization is non-trivial when share supply is bounded. On Polymarket, total YES shares outstanding equals total NO shares outstanding by construction. Comparing depth in dollar terms across markets at different price levels requires dividing resting depth by the market’s current mid-price to get a probability-normalized depth measure. Without this adjustment, a market trading at 90 cents looks ten times deeper than an identical market trading at 9 cents, even if both have the same number of shares resting.
Building a price-impact model for execution
A minimal execution model for a prediction market algo needs three inputs: the current quoted spread, the depth at each price level within two ticks of mid, and an estimate of Kyle’s lambda from the prior 24 hours of on-chain flow. Given those inputs, the expected cost of a market order of size Q is approximately ES/2 + lambda × Q. Markets where this cost exceeds the expected edge of a signal should be skipped or worked as limit orders. This framework applies directly to TCA for prediction market execution algos.
Kalshi vs. Polymarket: what each venue lets you measure
The structural differences between Kalshi and Polymarket are not just regulatory footnotes. They determine which microstructure questions you can answer with confidence and which require approximation.
Kalshi operates as a CFTC-regulated designated contract market. Contracts carry fixed $1 payouts, defined resolution sources, and centralized clearing. The API provides explicit maker/taker tags, fee schedules, and settlement timestamps. What it does not provide is wallet-level identity: accounts are anonymized, so you cannot track a specific trader’s activity across markets or link trading behavior to on-chain wallet history.
Polymarket settles on-chain. Every fill is a blockchain transaction. Every wallet is a public address. This means you can reconstruct the complete trading history of any wallet, link positions across markets, and identify Smart Money wallets by their historical accuracy. The cost is operational: you must maintain an on-chain event archive, handle reorgs, and perform the tx_hash join to get ground-truth direction.
The SoK on decentralized prediction markets frames this as a trade-off across seven design modules: infrastructure, market topic, share structure, trading mechanism, resolution, settlement, and archiving. Archiving and settlement are the two modules most consequential for reproducibility. On-chain settlement makes archiving deterministic; centralized settlement requires trusting the venue’s API to be complete and unrevised.
Kalshi advantages:
Explicit maker/taker role tags eliminate the direction-inference problem for role decomposition.
Regulatory oversight under CFTC provides contract standardization and resolution-source transparency.
Lower operational complexity: no on-chain join required.
Kalshi limitations:
No wallet-level traceability: Smart Money tracking is not possible.
Centralized matching means the order-book event log is a vendor-provided feed, not a trustless archive.
Settlement latency is defined by the venue’s internal process, not a public blockchain.
Polymarket advantages:
On-chain settlement provides ground-truth aggressor direction via OrderFilled events.
Wallet-level traceability enables Smart Money identification, cross-market position tracking, and informed-trader detection.
Archiving is trustless: any node can reconstruct the full event history from the chain.
Polymarket limitations:
Requires on-chain join for truth-aligned direction; public WebSocket feeds alone achieve only approximately 59% direction accuracy.
Chain reorgs and ingestion delays add operational complexity.
No explicit maker/taker tags in the WebSocket feed; role must be inferred from the OrderFilled event structure.
Dimension | Kalshi | Polymarket |
|---|---|---|
Venue type | Centralized, CFTC-regulated DCM | On-chain, decentralized settlement |
Quoted spread | Available via API snapshots | Available via WebSocket order book |
Role observability | Explicit maker/taker tags in API | Requires on-chain OrderFilled join |
Wallet traceability | Anonymized accounts | Full public wallet history |
Settlement latency | Venue-defined, hours to days | On-chain finality, minutes to hours |
Ground-truth direction | Not applicable (explicit tags) | On-chain OrderFilled event |
Forecast accuracy (Brier) | Measurable with role splits | Measurable with wallet-level splits |
For a research question about role-based return decomposition, Kalshi’s explicit tags make it the cleaner venue. For a question about informed-trader identification, Smart Money concentration, or wallet-level adverse selection, Polymarket’s on-chain architecture is the only option. Cross-venue work combining both, normalized through a unified data layer, is where the most complete picture emerges.
How does microstructure affect forecast accuracy and trading strategy?
The connection between microstructure quality and forecasting performance is not intuitive, but the data are consistent. True VPIN positively predicts Brier score errors: markets with higher informed-trading probability produce worse aggregate forecasts, likely because noise flow dominates price discovery in those markets. Gibbs spread negatively predicts Brier score errors: wider-spread markets tend to attract specialist informed traders who price the contract accurately.
This has a direct implication for model builders who use market prices as training labels. A price from a high-VPIN, low-spread market is a noisier label than a price from a low-VPIN, high-spread market. Weighting training examples by inverse VPIN, or filtering to markets where Gibbs spread exceeds a threshold, should improve label quality for any model trained on market-implied probabilities.
Execution implications
Spread and depth profiles determine when maker strategies dominate taker strategies. In markets where the quoted spread exceeds twice the expected edge of a signal, crossing the spread destroys the signal’s value. The correct response is to post a limit order and wait for the spread to come to you, accepting the risk of non-execution. In markets where depth is thin and VPIN is elevated, even limit orders face adverse selection: the counterparty who fills your resting order near resolution is more likely to be informed than at mid-market.
A practical execution framework:
Post limit orders in markets where quoted spread exceeds 3 cents and depth within two ticks of mid exceeds $500 in dollar terms.
Cross the spread only when the signal’s expected value exceeds the effective spread by a factor of at least 1.5.
Withdraw resting orders in the final two hours before resolution in markets where VPIN has risen above its 90th percentile for that market’s history.
For cross-venue arbitrage, compute expected capture net of both venues’ fees and the settlement latency differential before sizing the position.
Pro Tip: Combine wallet-level Smart Money signals with spread and depth filters before routing orders to automated agents. A Smart Money wallet’s position in a market is a stronger signal when that market also shows low VPIN and moderate spread, indicating that the informed trader’s edge is not already fully reflected in the price. High-VPIN markets with Smart Money activity often mean the information is already in the book.
Cross-venue arbitrage constraints
Settlement latency is the binding constraint on cross-venue arbitrage between Kalshi and Polymarket on correlated events. Kalshi settlement is centralized and may take hours; Polymarket settlement requires on-chain finality. A position opened to capture a price divergence between the two venues carries the risk that one venue resolves before the other, leaving a one-sided exposure. Sizing cross-venue positions to account for this asymmetric resolution risk, and monitoring the arbitrage signal in real time, is necessary for any systematic cross-venue strategy.
What open resources exist for replicating these analyses?
The replication infrastructure for prediction market microstructure is more developed than most quants expect. Three resources anchor the reproducible research ecosystem:
Polymarket-v1 Database (Arxiv): 1.20 billion trade records with ground-truth aggressor direction. The dataset includes replication code for the tx_hash join and for computing True VPIN and Gibbs spread from on-chain events. This is the reference dataset for any study that claims truth-aligned direction on Polymarket.
Anatomy of a Decentralized Prediction Market replication package (Arxiv): code to join 30 billion orderbook events to on-chain fills over a 52-day panel, compute the eight stylized facts, and reproduce the maker-wallet concentration and spread-profile results.
Becker/Kalshi replication materials (Jbecker): the 72.1 million trade Kalshi dataset with maker/taker labels, role-level return tables, and the wealth-transfer decomposition.
Reproducibility checklist
Before running any microstructure notebook, confirm:
The exact block range (Polymarket) or API date range (Kalshi) is fixed and documented.
The random seed for any subsampling is set and logged.
Partial fills are aggregated before spread computation.
Fee schedules match the period of the sample.
The join between off-chain and on-chain records uses tx_hash, not timestamp proximity.
Validation tests for trade-direction accuracy are run against a held-out on-chain sample before any downstream metric is computed.
Sample notebook task sequence
A minimal replication notebook covers three tasks in order:
Join orderbook events to on-chain OrderFilled records using tx_hash; validate direction accuracy against the ground-truth label; report the fraction correctly classified.
Compute True VPIN using on-chain aggressor direction; bucket by 1% of daily volume; plot VPIN against time-to-resolution to observe the late-resolution spike.
Replicate the maker/taker return table by price bin; apply dollar-weighting; split by resolution outcome to isolate the optimism tax.
For Python-based implementation, the Assymetrix Python API guide provides step-by-step ingestion patterns that align with these notebook tasks.
How does the Assymetrix Data API support microstructure research?
Assymetrix provides the unified, truth-aligned cross-venue event archive that the analyses above require. The platform indexes over 900 million on-chain events, covers more than five years of historical data, and normalizes schemas across Polymarket, Kalshi, and Limitless into a single integration layer. The Data API exposes this archive through time-series endpoints, orderbook tick archives, and wallet activity joins.
For replication work: The Assymetrix API delivers the three event streams required for truth-aligned microstructure analysis: orderbook tick archives (order-add, order-cancel events with nanosecond timestamps), trade-fill records joined to on-chain OrderFilled events with ground-truth aggressor direction, and wallet activity logs with Smart Money tags and Trader Skill Scores pre-computed. A single API integration replaces the operational work of maintaining separate Polymarket node archives and Kalshi API polling pipelines.
API endpoint patterns for common tasks
The minimal call sequence for a VPIN computation on Polymarket:
Pull orderbook tick events for a market using the
/v1/orderbook/eventsendpoint, specifyingmarket_id,start_block, andend_block. The response includes order-add and order-cancel events with canonical block timestamps.Pull trade-fill records from
/v1/tradesfor the same market and block range. Each record includestx_hash,aggressor_side(derived from on-chain OrderFilled),price, andsize.Join the two streams on
market_idandtimestamp_nsto build the full event timeline. Bucket signed volume by aggressor side into VPIN buckets of 1% daily volume. Compute VPIN as the ratio of absolute order-flow imbalance to total bucket volume.
For Gibbs spread, pull the same orderbook event stream and compute the serial covariance of mid-quote changes across consecutive trade events. The API’s normalized price field (in probability units, 0–100 cents) eliminates the need for price-level normalization.
API endpoint | Data returned | Key parameters | Use case |
|---|---|---|---|
| Order-add, order-cancel events | market_id, start_block, end_block | Spread, depth, VPIN computation |
| Trade fills with on-chain direction | market_id, date_range, venue | Maker/taker decomposition, TCA |
| Wallet trade history, Smart Money tag | address, market_id | Informed-trader identification |
| Market metadata, resolution outcome | category, status, venue | Sample construction, settlement joins |
Integration tips
Use bulk export endpoints for backtesting: the API supports compressed NDJSON exports for date ranges exceeding 30 days, which are faster than paginated requests for large historical samples.
For live agents, the WebSocket streaming endpoint delivers orderbook updates with sub-second latency; pair it with the REST trade endpoint to validate direction on fills as they arrive.
Timestamps in all API responses use canonical block time (Unix nanoseconds) for on-chain events and ISO 8601 UTC for Kalshi events; convert to a common epoch before joining cross-venue streams.
Pagination uses cursor-based tokens; store the cursor at each checkpoint so a failed run can resume without re-ingesting earlier pages.
Pro Tip: Use Assymetrix Smart Money wallet tags and Trader Skill Scores to build a labeled training set for direction models. Filter historical trades to wallets with Trader Skill Scores in the top decile, then use their aggressor-side decisions as positive labels for a signal model. This produces a higher-quality label set than using resolution outcome alone, because skilled wallets tend to trade early when the information advantage is largest.
The cross-venue signal generation guide walks through how to combine Smart Money tags with spread and depth filters to build a prioritized signal queue for automated agents.
What are the limits of current microstructure data, and what comes next?
Three measurement problems remain unresolved and should be stated plainly before any result is presented as settled.
Representative limitation: Even the best public-feed heuristics achieve only approximately 59% direction accuracy against on-chain truth on Polymarket. For venues without on-chain settlement, no ground-truth benchmark exists at all. Every VPIN, OFI, and TCA result computed from inferred direction on such venues carries an unknown and potentially large classification error.
Limitation 1: Direction classification in non-on-chain venues. Kalshi’s explicit maker/taker tags solve the role-decomposition problem but do not provide aggressor direction in the sense used for VPIN or OFI. Venues that provide neither on-chain settlement nor explicit role tags leave researchers with heuristics that the Polymarket-v1 benchmark shows are near-random.
Limitation 2: Category heterogeneity and selection bias. Stylized facts estimated on pooled samples mix markets with very different information environments. Sports markets, political markets, and financial markets attract different trader populations and have different resolution-information structures. Pooled estimates may reflect category composition rather than universal microstructure laws.
Limitation 3: Survivorship in thin markets. Markets that never attract resting liquidity on both sides are typically excluded from spread and depth analyses. This exclusion biases depth and spread estimates upward: the markets you can measure are the ones that attracted enough participation to generate a two-sided book.
Open research questions
The most productive directions for the next wave of prediction market microstructure research:
Optimism tax dynamics: formally model how the taker-side bias evolves as a market approaches resolution and test whether the bias is stronger for markets with longer resolution horizons.
Microstructure-driven forecast weighting: test whether weighting market-implied probabilities by inverse True VPIN improves aggregate calibration in a held-out sample.
Order-flow causality: use the on-chain event sequence to test Granger causality between Smart Money wallet flow and subsequent mid-quote revision.
AMM vs. CLOB design trade-offs: the SoK framework identifies automated market maker designs as an alternative to central limit order books in decentralized prediction markets; a controlled comparison of spread, depth, and forecast accuracy across the two mechanisms would be a significant contribution.
Experimental designs worth pursuing: randomized maker incentive programs (varying rebate levels across matched market pairs), controlled liquidity injections to test depth resiliency, and time-based resolution tests that vary the announcement-to-resolution window to measure its effect on late-resolution liquidity collapse.
Where should quant microstructure research go next?
Three priorities stand out for researchers and traders who want to move from replication to original contribution.
Truth-aligned metrics first. The classifier accuracy finding is not a minor caveat. Near-random direction inference means that any study using heuristic classifiers on venues without on-chain truth is measuring noise. The field needs more studies that treat on-chain validation as a prerequisite, not an optional robustness check.
Wallet-tracking and TCA as standard tools. Equity microstructure has had transaction cost analysis as a standard institutional practice for decades. Prediction markets are only beginning to develop TCA frameworks that account for binary payouts, resolution-driven order flow, and the absence of a consolidated tape. Wallet-level tracking on Polymarket makes this possible in a way that has no equity analog.
Model complexity vs. measurement noise. The temptation in quant research is to add model complexity when results are noisy. In prediction market microstructure, the noise is often measurement error in direction classification, not model misspecification. Adding a second factor to a VPIN model built on 59%-accurate direction data does not improve the model; it fits the noise more precisely. The right response is to improve the measurement, not the model.
On ethics: wallet-level Smart Money analyses on Polymarket involve public blockchain data, but the individuals behind those wallets may not expect their trading behavior to be published in academic work. Standard practice in published research should include pseudonymization of wallet addresses, IRB review where the institution requires it for human-subjects data, and a disclosure policy that does not name individual traders without consent. The fact that the data is technically public does not settle the ethical question.
Assymetrix gives you the data infrastructure to run this research
Prediction market microstructure research stalls at the data layer. Maintaining separate Polymarket node archives, Kalshi API polling pipelines, and wallet-activity databases is months of engineering before the first spread estimate is computed.
Assymetrix removes that bottleneck. The platform’s unified cross-venue Data API delivers truth-aligned orderbook tick archives, on-chain trade fills with ground-truth aggressor direction, and wallet-level Smart Money tags across Polymarket, Kalshi, and Limitless through a single integration. The historical archive spans more than five years and over 900 million indexed on-chain events, normalized to a common schema so cross-venue spread and VPIN comparisons require no additional cleaning.
Prebuilt datasets available to subscribers include Polymarket truth-aligned orderbook joins, Kalshi maker/taker-labeled trade samples, and historical VPIN series by market category. For quant teams building execution algos or AI agents, the cross-venue signal guide shows how to combine Smart Money wallet tags with spread filters to build a prioritized signal queue. Start with the /v1/trades endpoint, pull a 30-day Polymarket sample with on-chain direction, and run the maker/taker return table by price bin. That first query reproduces the core wealth-transfer result from the Becker analysis in under an hour. Access the API at Data.
Sources
The following resources support the empirical claims and methods in this article:
This article is general information, not a substitute for advice from a qualified financial advisor. Consult a qualified financial professional about your own circumstances before acting on anything here.
FAQ
What is market microstructure data in prediction markets?
Market microstructure data in prediction markets includes tick-level order-book events (order-add, order-cancel, trade-fill), settlement records, and wallet activity logs. For on-chain venues like Polymarket, the authoritative source is the on-chain OrderFilled event, which provides ground-truth aggressor direction that public WebSocket feeds cannot reliably infer.
What do prediction markets actually predict?
Prediction markets aggregate traders’ probability estimates for specific future events by pricing binary contracts that pay $1 if the event occurs and $0 if it does not. The contract price reflects the market’s consensus probability, though microstructure factors like spread, VPIN, and maker/taker flow composition affect how accurately that price tracks the true probability.
What is the structure of a prediction market?
A prediction market consists of a central limit order book or automated market maker where traders post bids and offers on binary outcome contracts, a resolution mechanism tied to a defined information source, and a settlement process that pays winning contract holders. Regulated U.S. venues like Kalshi operate under CFTC oversight with fixed $1 payouts and defined resolution sources.
How does microstructure affect prediction market accuracy?
Markets with higher True VPIN (informed-trading probability) show systematically higher Brier score errors, while markets with wider Gibbs spreads tend to show lower forecasting errors due to a selection effect: high-spread niche markets attract specialist informed traders who price contracts accurately.
Which platforms provide the best data for microstructure research?
Polymarket provides on-chain ground-truth aggressor direction via OrderFilled events and wallet-level traceability, making it the reference venue for truth-aligned microstructure studies. Kalshi provides explicit maker/taker role tags through its API, enabling clean role decomposition without an on-chain join. Assymetrix aggregates both venues into a unified API with pre-joined truth-aligned trade records, Smart Money wallet tags, and historical VPIN series, reducing the data engineering required to replicate published results.
Other Blog


