Execution Aware Prediction Market Backtests: 5 Data Elements for Devs
Execution Aware Prediction Market Backtests: 5 Data Elements for Devs
Execution Aware Prediction Market Backtests: 5 Data Elements for Devs
A playbook for devs to build execution aware prediction market backtests: five core data layers, episode replays, and a standing audit suite to ensure...
Execution Aware Prediction Market Backtests: 5 Data Elements for Devs
A rigorous prediction market backtest requires five data elements: point-in-time prices, trade-level fills, orderbook snapshots, settlement events kept separate from price history, and wallet-level activity for tracking committed capital. Without a deterministic, execution-realistic replay harness that models maker/taker fees and fills, and without standing causality tests run against every strategy, measured performance is close to meaningless. PredictionMarketBench documents this exact failure mode, and it’s the reason most backtest results published on prediction markets don’t survive contact with live order flow.
TL;DR:
Accurate prediction market backtests require multiple data layers, including immutable market metadata, trade-level records, and orderbook snapshots, to prevent biases like look-ahead bias.
On-chain data provides transparency for settlement and trades, but lacks orderbook depth, making normalized third-party datasets essential for cross-venue analysis.
Building a deterministic, execution-aware replay engine that models fees, latency, and partial fills is critical to measuring strategies realistically and avoiding inflated performance results.
Common backtesting mistakes include look-ahead leaks, survivorship bias, use of stale prices, and ignoring orderbook liquidity, all of which can be detected with mechanical checks.
A robust pipeline involves continuous ingestion of data streams, canonical identification of markets, point-in-time snapshots, and comprehensive audits, with five or more years of history to ensure statistical significance.
AssymetrixBuild More Reliable Market BacktestsAssymetrix provides unified historical and real-time prediction market data across Polymarket, Kalshi, and Limitless through one integration.Explore Assymetrix
Table of Contents
What Data Does Prediction Market Data for Backtesting Actually Require?
Where Can You Source Historical Prediction Market Data?
How Do You Build an Execution-Realistic Replay Engine?
What Are the Most Common Backtesting Data Mistakes?
What Does a Production-Ready Backtest Pipeline Look Like?
How Assymetrix Supports Reproducible, Execution-Aware Backtests
How Do You Clean and Preprocess Prediction Market Data?
How Do You Engineer Features From Prediction Market Signals?
Which Metrics Actually Evaluate a Prediction Market Backtest?
How Do You Handle Missing or Incomplete Historical Data?
How Do You Model Market Impact and Liquidity in Backtests?
What Do Real Benchmark Strategy Backtests Look Like?
What the Data Actually Tells You About Backtesting Discipline
Get Cross-Venue Historical Data for Your Next Backtest
Sources
What Data Does Prediction Market Data for Backtesting Actually Require?
Every rigorous prediction market backtest rests on five data layers, and skipping any one of them introduces a specific, predictable bias. The schema below reflects the practitioner structure outlined in Chapter 26 of the Backtesting Prediction Market Strategies guide, extended with the lifecycle and actor fields that matter specifically for cross-venue quant research.
Market static fields and lifecycle timestamps come first. You need market_id, question_text, category, creation_timestamp, close_timestamp, and resolution_timestamp stored as immutable point-in-time records. If your database updates a market’s status field in place rather than appending a new row, you’ve destroyed the ability to know what the market looked like at any past instant, which is the root cause of most look-ahead contamination.
Trade-level fields need to include execution timestamp, price, size, and a maker/taker flag. Orderbook snapshot fields need best bid, best ask, top-N depth, and a sequence ID so reconstructions can be verified against the live stream. Time-series snapshots at 15-minute OHLCV resolution give you a manageable index for scanning years of history, while the trade-level stream underneath it gives you the granularity to model realistic fills.
Data layer | Core fields | Update cadence |
|---|---|---|
Market metadata | market_id, question, category, lifecycle timestamps | On creation, close, resolution (append-only) |
Trade prints | timestamp, price, size, maker/taker flag | Per trade, millisecond precision |
Orderbook snapshots | best bid/ask, top-N depth, sequence_id | Per book change or fixed interval |
OHLCV time series | open, high, low, close, volume | 15-minute bars |
Settlement events | outcome, resolution_source, correction_flag | On resolution or correction |
Wallet/actor activity | wallet_id, position_size, entry_price | Per fill |
Settlement events deserve their own table, separate from price history, because resolution outcomes and price corrections need to be joinable against price data without ever leaking into it. Wallet and actor IDs matter too, since Smart Money tracking depends on knowing which addresses or accounts are accumulating positions ahead of resolution.
Store everything in immutable episode directories keyed to canonical market IDs that hold across venues. A single year of trade-level data across three major venues typically runs into the hundreds of gigabytes once orderbook snapshots are included, so plan storage accordingly.
Pro Tip: Never overwrite a market metadata row on status change. Append a new row with a fresh timestamp instead, or you lose the ability to reconstruct exactly what any point-in-time query would have returned.
Where Can You Source Historical Prediction Market Data?
You have three practical paths: venue-native APIs, on-chain extraction, and third-party normalized datasets, and each comes with a specific tradeoff between coverage and fidelity.
Venue APIs (Polymarket, Kalshi, Limitless) give you the freshest and most authoritative data for their own platform, but each uses a different schema, different rate limits, and different historical depth, so cross-venue research means building three separate ingestion pipelines before you write a line of strategy code.
On-chain extraction works for venues like Polymarket that settle on public chains, giving you trade and settlement transparency, but it typically lacks orderbook depth and requires substantial indexing infrastructure of its own.
Third-party normalizers solve the schema-fragmentation problem by mapping every venue into canonical market and trade IDs, which is the only way to run a signal across Polymarket and Kalshi without rewriting your feature pipeline twice.
Whichever path you pick, check licensing terms before bulk export, and confirm the archive is genuinely immutable rather than a live table that gets silently corrected. For developers wanting a single integration point, the Assymetrix Data API and its Polymarket-specific documentation cover both the normalized schema and on-chain nuances in one reference.
How Do You Build an Execution-Realistic Replay Engine?
A backtest that ignores execution mechanics isn’t measuring a strategy, it’s measuring a fantasy. PredictionMarketBench formalizes this with an episode-based replay format that any serious quant pipeline should copy structurally, even if the underlying tooling differs.
Construct episodes as self-contained packages. Each episode gets a
metadata.json(market details, lifecycle timestamps), anorderbook.parquet(sequenced book snapshots), atrades.parquet(execution-level prints), and asettlement.json(final outcome, resolution source). Strict sequence numbers and timestamp ordering let two different engines replay the same episode and reconcile to identical fills.Choose a fill model deliberately. Taker-only models are simpler but overstate what’s achievable; maker/taker models with probability-of-fill weighting against top-N depth are closer to reality. Either way, slippage should be derived from actual depth at the time of order placement, not from a flat assumption.
Model latency and queue position. Even a simplified model, order priority by timestamp, explicit cancellation handling, and a fixed latency offset, catches races that a naive fill-at-quote assumption misses entirely.
Log the outputs that matter. Every episode replay should emit a trade log, an equity curve, fill ratio, realized slippage, total fees paid, and per-episode P&L, matching the metric set PredictionMarketBench uses for reproducible agent comparison.
Fee modeling alone can swing measured returns by several percentage points on short-horizon strategies, since maker rebates and taker fees compound differently depending on how aggressively a strategy crosses the spread.
What Are the Most Common Backtesting Data Mistakes?
Most invalid backtests fail for one of four reasons, and all four are detectable with mechanical checks rather than judgment calls.
Look-ahead leaks from same-bar fills. If your simulator lets a strategy fill at a price observed in the same bar it decided to trade, you’ve handed it information it couldn’t have had. Controlled experiments show same-bar fills and centered-feature peeks can manufacture dramatic Sharpe ratio inflation purely as an artifact of the leak, not genuine edge.
Survivorship bias from delisted markets. Dropping markets that closed early or never resolved cleanly from your historical universe inflates results, because you’re implicitly filtering for markets that behaved well. Preserve the original universe, including dead markets, in every backtest run.
End-of-day price substitution. Using daily closes instead of trade-level prices in a market that trades thinly overnight will misprice fills badly. This gets worse in low-volume markets, where a single quoted price can sit stale for hours while real trades happen elsewhere in the book.
Confusing quoted price with tradable price. The best bid/ask you see in a snapshot isn’t necessarily fillable at full size, particularly in markets with light open interest.
Four audits catch nearly all of these: a shift-fill test (delay every fill by one bar and see if performance survives), a causal feature recompute (rebuild every feature using only data available at decision time), a constrained-random baseline (compare your strategy against random entries within the same universe and constraints), and cross-event validation across multiple market categories.
Pro Tip: Run the shift-fill test as a standing part of your continuous integration, not a one-time sanity check. Research on look-ahead leaks found that mechanical audits like this one catch the overwhelming majority of accidental leaks before a strategy ever reaches production.
What Does a Production-Ready Backtest Pipeline Look Like?
Reduced to its essentials, a reproducible prediction market backtest pipeline follows a short sequence.
Ingest three streams continuously: trade prints, orderbook updates, and lifecycle events, writing each to an immutable episode store rather than a mutable database table.
Assign canonical IDs to every market at ingestion so cross-venue joins work without a separate reconciliation step later.
Snapshot point-in-time state for every market at fixed intervals, so any backtest window can be reconstructed exactly as it existed historically.
Run every strategy through a deterministic replay engine configured with an explicit maker/taker fee schedule and a depth-based slippage model, never a flat-fee shortcut.
Execute the standing audit suite (shift-fill, causal recompute, random baseline) before trusting any result.
Retain long history. Practitioner guidance recommends five or more years of history, or a large enough event count, specifically because binary-outcome strategies need substantial sample sizes to separate genuine edge from noise.
Step | What it prevents |
|---|---|
Immutable episode ingestion | Silent data revision, look-ahead contamination |
Canonical IDs | Cross-venue join errors, duplicate market counting |
Point-in-time snapshots | Survivorship bias, retroactive metadata leaks |
Deterministic maker/taker replay | Inflated P&L from unrealistic fills |
Standing audit suite | Same-bar fills, centered-feature leaks |
5+ years / high event count | Statistically insignificant sample sizes |
How Assymetrix Supports Reproducible, Execution-Aware Backtests
Assymetrix maintains a historical backfill of roughly 1.5 terabytes spanning more than 900 million indexed events, with trade-level granularity across Polymarket, Kalshi, and Limitless going back to September 2020. That history includes over 200 million OHLCV snapshots sampled at 15-minute resolution, giving quants both a coarse index for scanning years of markets and the trade-level stream underneath for building execution-realistic fill models.
A typical workflow looks like this:
Pull an episode package for a target market window through the Data API, including metadata, orderbook snapshots, and trade prints.
Run the episode through a maker/taker replay configured with venue-specific fee schedules.
Compute fill ratio and fee-adjusted Sharpe ratio from the replay output, then compare against the constrained-random baseline before drawing any conclusion.
The same canonical ID structure that lets you join Polymarket and Kalshi markets for cross-venue arbitrage research also makes multi-venue backtests tractable without a separate reconciliation layer for each source. Developers building on Polymarket specifically can start with the Polymarket data resources before expanding a strategy across venues.
How Do You Clean and Preprocess Prediction Market Data?
Prediction market data carries three cleaning problems that standard financial time-series pipelines don’t anticipate. First, binary and multi-outcome markets often report price as an implied probability between 0 and 1, and mixing that convention with cents-based pricing from a different venue without normalizing first will silently corrupt any cross-venue feature.
Second, orderbook snapshots frequently contain phantom liquidity, resting orders that get pulled the instant they’d be filled. Filtering snapshots against realized trade prints, and discarding book levels that never once absorbed a fill during the observation window, removes most of this noise before it reaches your feature pipeline.
Third, timestamp alignment across venues is inconsistent. Some venues timestamp at order receipt, others at block confirmation for on-chain settlement, introducing skew of several seconds to minutes. Resample every venue’s stream to a common clock, typically UTC with millisecond precision, before joining across sources. Deduplicate trade prints that arrive twice under retries, using trade ID rather than timestamp plus price as the dedup key, since two genuine trades can share both.
Finally, treat resolved-but-uncorrected markets carefully: a settlement event that arrives, then gets amended hours later, needs both versions preserved rather than overwritten, so your point-in-time queries stay honest about what was actually knowable at each moment.
How Do You Engineer Features From Prediction Market Signals?
Feature engineering for prediction markets differs from equities in one structural way: price is bounded between 0 and 1, and it converges toward a known terminal value (0 or 1) as resolution approaches. That convergence dynamic should shape every feature you build.
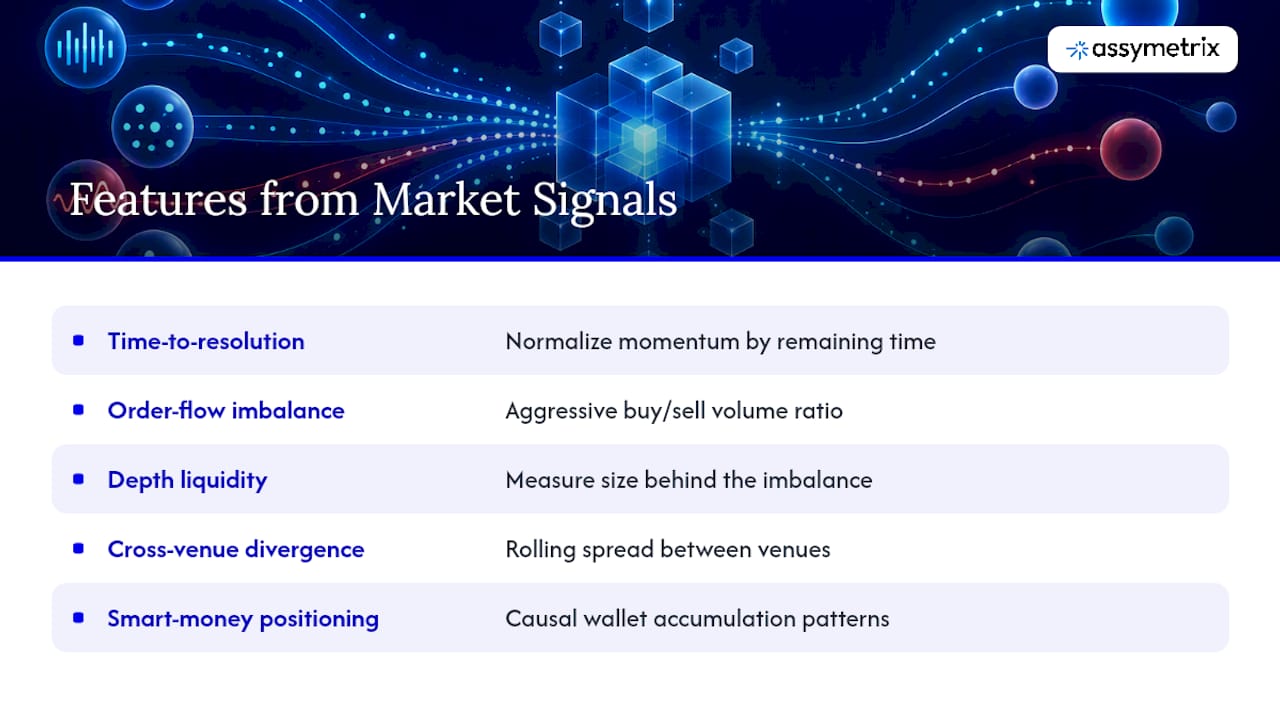
Time-to-resolution features matter more here than in most asset classes. A market trading at 0.60 with three months left behaves very differently than the same price with three days left, so normalize momentum and volatility features by remaining time, not just by lookback window.
Order flow imbalance, the ratio of aggressive buy volume to aggressive sell volume over a rolling window, tends to carry more signal than raw price momentum in markets with sparse trading, since it captures conviction rather than noise from wide bid/ask spreads. Pair it with depth-based liquidity metrics so the feature accounts for how much size actually sits behind the imbalance.
Cross-venue divergence is a feature category unique to this asset class: the same event, priced simultaneously on Polymarket and Kalshi, occasionally diverges by several cents when liquidity is thin on one side. That spread, tracked as a rolling feature rather than a point-in-time snapshot, feeds directly into arbitrage-style signal construction.
Smart Money positioning, wallet-level accumulation patterns ahead of major price moves, works as a leading feature when computed causally: only count positions established before the timestamp your feature is evaluated at, never positions visible in hindsight.
Which Metrics Actually Evaluate a Prediction Market Backtest?
Accuracy alone is a poor metric for prediction market strategies, because a strategy that correctly calls 70% of markets can still lose money if its sizing is wrong on the 30% it misses. Profitability metrics need to sit alongside directional accuracy, not replace it.
Fee-adjusted Sharpe ratio should be computed after subtracting the maker/taker fees and slippage the replay engine actually charged, never on gross P&L. A strategy that looks strong before fees and mediocre after them is telling you its edge is too thin to survive real execution costs.
Fill ratio measures how much of your intended order size actually executed. A strategy backtested assuming full fills, then deployed live where it fills 40% of intended size, will behave nothing like its backtest.
Calibration error, the gap between a strategy’s implied probability and realized outcome frequency across many markets, is arguably the single most prediction-market-specific metric available, since it directly tests whether the strategy’s edge is genuine forecasting skill rather than lucky timing.
Maximum drawdown and per-episode P&L variance round out the set, particularly because prediction markets settle in discrete binary jumps rather than continuous price paths, so drawdown profiles look choppier than in traditional asset classes even when the underlying edge is real.
How Do You Handle Missing or Incomplete Historical Data?
Gaps in prediction market history come from three sources: venue API downtime, markets that launched and closed within the same data collection cycle, and orderbook snapshots that simply weren’t captured at the configured interval. Each needs a different fix.
For short gaps in continuous streams (a few minutes of missing trade prints), forward-filling the last known orderbook state is acceptable, but never forward-fill a settlement outcome, since that field should only ever populate at the moment resolution actually occurs.
For markets with sparse or no trade history during part of their lifecycle, resist the urge to interpolate a synthetic price. A flat, low-volume period is itself information, evidence that a market wasn’t attracting committed capital, and smoothing it away removes a genuine feature. Flag these periods explicitly with a low_liquidity indicator rather than disguising them.
For entirely missing markets, the ones that existed but were never captured by your ingestion pipeline, cross-check venue-published market lists against your own database periodically. A market absent from your archive but present in the venue’s own historical index is a coverage gap, not a resolved absence, and needs backfilling before you trust any universe-wide statistic drawn from that period.
Never drop incomplete markets from your universe purely for convenience. That’s the same mechanism that produces survivorship bias, just applied at the data-quality layer instead of the market-selection layer.
How Do You Model Market Impact and Liquidity in Backtests?
A backtest that fills every order at the quoted price regardless of size is measuring a strategy that can’t exist. Market impact modeling in prediction markets starts with top-N orderbook depth: for any intended order size, walk the book level by level and compute the volume-weighted average fill price rather than assuming a single quote.
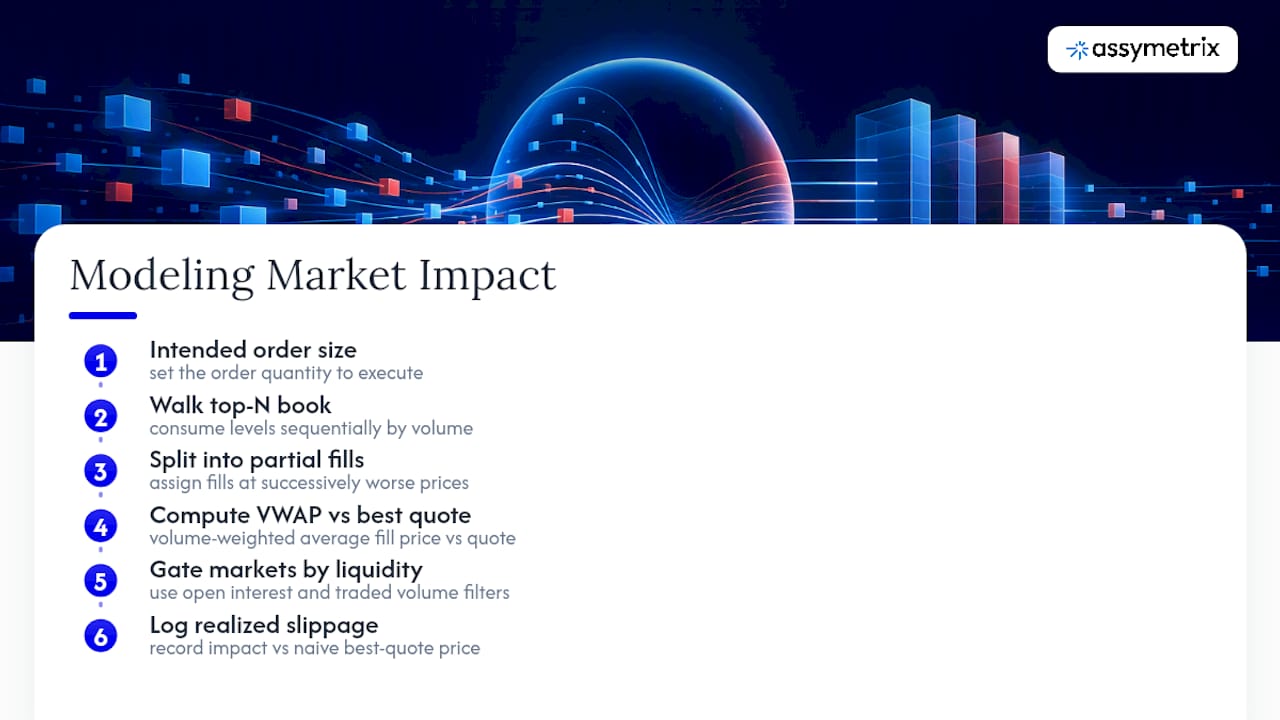
For strategies sized larger than a market’s typical top-of-book depth, model partial fills explicitly, splitting an order across multiple simulated fills at successively worse prices, and log the realized slippage against the naive best-quote price so you know exactly how much impact cost your strategy is absorbing. Open interest and traded volume, key filters for separating committed capital from speculative noise, should gate which markets a strategy is even allowed to trade in backtest, matching whatever liquidity floor it would need to respect live.
A strategy that only works when it assumes unlimited liquidity at the quoted price will fail the moment it meets a real order book. Building this constraint into the replay engine from day one, rather than bolting it on after a naive backtest looks promising, is the difference between a strategy that survives deployment and one that doesn’t.
What Do Real Benchmark Strategy Backtests Look Like?
Three benchmark strategy types illustrate how the requirements above come together in practice.
A mean-reversion strategy on high open-interest markets enters when price deviates more than a fixed threshold from a volume-weighted moving average, exits on reversion or time decay near resolution. Its backtest setup requires trade-level prints for the moving average, orderbook depth for realistic entry fills, and an open-interest filter excluding thin markets, since mean reversion is fragile precisely where single positions can move price.
A cross-venue arbitrage strategy monitors the same canonical event priced on two venues simultaneously, entering when the spread exceeds combined fees plus estimated slippage. Its backtest setup demands synchronized, millisecond-aligned trade streams from both venues and a strict causal feature computation, since even a few seconds of look-ahead can manufacture an arbitrage opportunity that never actually existed.
A Smart Money following strategy tracks wallet-level accumulation ahead of resolution and takes positions in the same direction once accumulation crosses a threshold. Its backtest setup needs wallet-level fill data joined to trade prints, with strict point-in-time gating so the strategy never sees accumulation that happened after its decision timestamp. All three benchmarks should run through the same deterministic replay engine and the same standing audit suite described earlier, so results across strategy types are directly comparable.
What the Data Actually Tells You About Backtesting Discipline
The conventional advice on prediction market backtesting treats it like an extension of equities backtesting with a different price bound. That’s the wrong mental model. Equities backtests worry primarily about transaction costs and regime change. Prediction market backtests worry about something more structural: the outcome data itself arrives at a specific moment, and if your pipeline lets that moment bleed backward even slightly, your entire performance number is manufactured, not measured.
What’s underrated here is how cheap the fix actually is. A shift-fill test and a causal feature recompute take an afternoon to build and should run on every strategy before it’s trusted, yet most backtests skip both entirely. What’s overrated is chasing bigger feature sets before the replay engine itself is trustworthy. A sophisticated model built on top of a leaky simulator just produces a more convincing wrong answer.
If you take one thing from this guide, prioritize the harness before the strategy. Get deterministic, execution-aware replay working first, on a small dataset if necessary. Everything downstream, feature engineering, benchmark comparisons, live deployment confidence, depends on that foundation holding.
— Dean
Get Cross-Venue Historical Data for Your Next Backtest
Assymetrix gives quants the cross-venue infrastructure this guide describes without forcing a separate integration for each platform: normalized schemas, canonical market IDs, and episode-ready historical packages spanning Polymarket, Kalshi, and Limitless.

Instead of building three separate ingestion pipelines and reconciling schemas by hand, you get one integration covering trade-level fills, orderbook snapshots, and settlement events going back to September 2020, plus Smart Money wallet tracking already computed for you. The Data API documentation covers REST and WebSocket access, and subscription tiers scale from research-grade access up to full institutional bulk export, with current pricing listed on the site. Start by pulling a sample episode through the Data API landing page and running it through your own replay engine before committing to a larger backtest.
Sources
How Much Sharpe Does a Look-Ahead Leak Manufacture? A Controlled Study
Chapter 26: Backtesting Prediction Market Strategies | Prediction Markets
FAQ
What Is Point-in-Time Data and Why Does It Matter?
Point-in-time data records exactly what a market’s price, book, and metadata looked like at a specific historical moment, without later corrections or resolution outcomes bleeding backward. It’s the single most important safeguard against look-ahead bias, which can manufacture large, entirely fake performance gains in an otherwise plausible-looking backtest.
How Many Years of History Do I Need for a Valid Backtest?
Practitioner guidance recommends five or more years of history, or an equivalently large event count, for binary-outcome strategies to reach statistical significance. Shorter windows risk mistaking noise for genuine edge, especially on strategies with a small number of trades per year.
Can I Backtest Using Only On-Chain Data?
On-chain extraction works for venues that settle publicly, like Polymarket, and gives reliable trade and settlement records, but it typically lacks the orderbook depth needed for realistic fill modeling. Combining on-chain settlement data with a normalized orderbook feed, such as the one available through Assymetrix, gives a more complete picture than either source alone.
What’s the Biggest Data Mistake in Prediction Market Backtesting?
Same-bar fills, where a strategy fills at a price only observable after its decision was made, is the most common and most damaging mistake, and it can inflate measured Sharpe ratios dramatically. A shift-fill audit, delaying every fill by one bar and rechecking performance, catches this reliably.
Does Assymetrix Provide Trade-Level Data Across All Major Venues?
Assymetrix provides trade-level granularity across Polymarket, Kalshi, and Limitless dating back to September 2020, backed by roughly 1.5 terabytes of historical data and over 900 million indexed events. Current subscription pricing for the Data API is listed on the Assymetrix site.
Execution Aware Prediction Market Backtests: 5 Data Elements for Devs
A rigorous prediction market backtest requires five data elements: point-in-time prices, trade-level fills, orderbook snapshots, settlement events kept separate from price history, and wallet-level activity for tracking committed capital. Without a deterministic, execution-realistic replay harness that models maker/taker fees and fills, and without standing causality tests run against every strategy, measured performance is close to meaningless. PredictionMarketBench documents this exact failure mode, and it’s the reason most backtest results published on prediction markets don’t survive contact with live order flow.
TL;DR:
Accurate prediction market backtests require multiple data layers, including immutable market metadata, trade-level records, and orderbook snapshots, to prevent biases like look-ahead bias.
On-chain data provides transparency for settlement and trades, but lacks orderbook depth, making normalized third-party datasets essential for cross-venue analysis.
Building a deterministic, execution-aware replay engine that models fees, latency, and partial fills is critical to measuring strategies realistically and avoiding inflated performance results.
Common backtesting mistakes include look-ahead leaks, survivorship bias, use of stale prices, and ignoring orderbook liquidity, all of which can be detected with mechanical checks.
A robust pipeline involves continuous ingestion of data streams, canonical identification of markets, point-in-time snapshots, and comprehensive audits, with five or more years of history to ensure statistical significance.
AssymetrixBuild More Reliable Market BacktestsAssymetrix provides unified historical and real-time prediction market data across Polymarket, Kalshi, and Limitless through one integration.Explore Assymetrix
Table of Contents
What Data Does Prediction Market Data for Backtesting Actually Require?
Where Can You Source Historical Prediction Market Data?
How Do You Build an Execution-Realistic Replay Engine?
What Are the Most Common Backtesting Data Mistakes?
What Does a Production-Ready Backtest Pipeline Look Like?
How Assymetrix Supports Reproducible, Execution-Aware Backtests
How Do You Clean and Preprocess Prediction Market Data?
How Do You Engineer Features From Prediction Market Signals?
Which Metrics Actually Evaluate a Prediction Market Backtest?
How Do You Handle Missing or Incomplete Historical Data?
How Do You Model Market Impact and Liquidity in Backtests?
What Do Real Benchmark Strategy Backtests Look Like?
What the Data Actually Tells You About Backtesting Discipline
Get Cross-Venue Historical Data for Your Next Backtest
Sources
What Data Does Prediction Market Data for Backtesting Actually Require?
Every rigorous prediction market backtest rests on five data layers, and skipping any one of them introduces a specific, predictable bias. The schema below reflects the practitioner structure outlined in Chapter 26 of the Backtesting Prediction Market Strategies guide, extended with the lifecycle and actor fields that matter specifically for cross-venue quant research.
Market static fields and lifecycle timestamps come first. You need market_id, question_text, category, creation_timestamp, close_timestamp, and resolution_timestamp stored as immutable point-in-time records. If your database updates a market’s status field in place rather than appending a new row, you’ve destroyed the ability to know what the market looked like at any past instant, which is the root cause of most look-ahead contamination.
Trade-level fields need to include execution timestamp, price, size, and a maker/taker flag. Orderbook snapshot fields need best bid, best ask, top-N depth, and a sequence ID so reconstructions can be verified against the live stream. Time-series snapshots at 15-minute OHLCV resolution give you a manageable index for scanning years of history, while the trade-level stream underneath it gives you the granularity to model realistic fills.
Data layer | Core fields | Update cadence |
|---|---|---|
Market metadata | market_id, question, category, lifecycle timestamps | On creation, close, resolution (append-only) |
Trade prints | timestamp, price, size, maker/taker flag | Per trade, millisecond precision |
Orderbook snapshots | best bid/ask, top-N depth, sequence_id | Per book change or fixed interval |
OHLCV time series | open, high, low, close, volume | 15-minute bars |
Settlement events | outcome, resolution_source, correction_flag | On resolution or correction |
Wallet/actor activity | wallet_id, position_size, entry_price | Per fill |
Settlement events deserve their own table, separate from price history, because resolution outcomes and price corrections need to be joinable against price data without ever leaking into it. Wallet and actor IDs matter too, since Smart Money tracking depends on knowing which addresses or accounts are accumulating positions ahead of resolution.
Store everything in immutable episode directories keyed to canonical market IDs that hold across venues. A single year of trade-level data across three major venues typically runs into the hundreds of gigabytes once orderbook snapshots are included, so plan storage accordingly.
Pro Tip: Never overwrite a market metadata row on status change. Append a new row with a fresh timestamp instead, or you lose the ability to reconstruct exactly what any point-in-time query would have returned.
Where Can You Source Historical Prediction Market Data?
You have three practical paths: venue-native APIs, on-chain extraction, and third-party normalized datasets, and each comes with a specific tradeoff between coverage and fidelity.
Venue APIs (Polymarket, Kalshi, Limitless) give you the freshest and most authoritative data for their own platform, but each uses a different schema, different rate limits, and different historical depth, so cross-venue research means building three separate ingestion pipelines before you write a line of strategy code.
On-chain extraction works for venues like Polymarket that settle on public chains, giving you trade and settlement transparency, but it typically lacks orderbook depth and requires substantial indexing infrastructure of its own.
Third-party normalizers solve the schema-fragmentation problem by mapping every venue into canonical market and trade IDs, which is the only way to run a signal across Polymarket and Kalshi without rewriting your feature pipeline twice.
Whichever path you pick, check licensing terms before bulk export, and confirm the archive is genuinely immutable rather than a live table that gets silently corrected. For developers wanting a single integration point, the Assymetrix Data API and its Polymarket-specific documentation cover both the normalized schema and on-chain nuances in one reference.
How Do You Build an Execution-Realistic Replay Engine?
A backtest that ignores execution mechanics isn’t measuring a strategy, it’s measuring a fantasy. PredictionMarketBench formalizes this with an episode-based replay format that any serious quant pipeline should copy structurally, even if the underlying tooling differs.
Construct episodes as self-contained packages. Each episode gets a
metadata.json(market details, lifecycle timestamps), anorderbook.parquet(sequenced book snapshots), atrades.parquet(execution-level prints), and asettlement.json(final outcome, resolution source). Strict sequence numbers and timestamp ordering let two different engines replay the same episode and reconcile to identical fills.Choose a fill model deliberately. Taker-only models are simpler but overstate what’s achievable; maker/taker models with probability-of-fill weighting against top-N depth are closer to reality. Either way, slippage should be derived from actual depth at the time of order placement, not from a flat assumption.
Model latency and queue position. Even a simplified model, order priority by timestamp, explicit cancellation handling, and a fixed latency offset, catches races that a naive fill-at-quote assumption misses entirely.
Log the outputs that matter. Every episode replay should emit a trade log, an equity curve, fill ratio, realized slippage, total fees paid, and per-episode P&L, matching the metric set PredictionMarketBench uses for reproducible agent comparison.
Fee modeling alone can swing measured returns by several percentage points on short-horizon strategies, since maker rebates and taker fees compound differently depending on how aggressively a strategy crosses the spread.
What Are the Most Common Backtesting Data Mistakes?
Most invalid backtests fail for one of four reasons, and all four are detectable with mechanical checks rather than judgment calls.
Look-ahead leaks from same-bar fills. If your simulator lets a strategy fill at a price observed in the same bar it decided to trade, you’ve handed it information it couldn’t have had. Controlled experiments show same-bar fills and centered-feature peeks can manufacture dramatic Sharpe ratio inflation purely as an artifact of the leak, not genuine edge.
Survivorship bias from delisted markets. Dropping markets that closed early or never resolved cleanly from your historical universe inflates results, because you’re implicitly filtering for markets that behaved well. Preserve the original universe, including dead markets, in every backtest run.
End-of-day price substitution. Using daily closes instead of trade-level prices in a market that trades thinly overnight will misprice fills badly. This gets worse in low-volume markets, where a single quoted price can sit stale for hours while real trades happen elsewhere in the book.
Confusing quoted price with tradable price. The best bid/ask you see in a snapshot isn’t necessarily fillable at full size, particularly in markets with light open interest.
Four audits catch nearly all of these: a shift-fill test (delay every fill by one bar and see if performance survives), a causal feature recompute (rebuild every feature using only data available at decision time), a constrained-random baseline (compare your strategy against random entries within the same universe and constraints), and cross-event validation across multiple market categories.
Pro Tip: Run the shift-fill test as a standing part of your continuous integration, not a one-time sanity check. Research on look-ahead leaks found that mechanical audits like this one catch the overwhelming majority of accidental leaks before a strategy ever reaches production.
What Does a Production-Ready Backtest Pipeline Look Like?
Reduced to its essentials, a reproducible prediction market backtest pipeline follows a short sequence.
Ingest three streams continuously: trade prints, orderbook updates, and lifecycle events, writing each to an immutable episode store rather than a mutable database table.
Assign canonical IDs to every market at ingestion so cross-venue joins work without a separate reconciliation step later.
Snapshot point-in-time state for every market at fixed intervals, so any backtest window can be reconstructed exactly as it existed historically.
Run every strategy through a deterministic replay engine configured with an explicit maker/taker fee schedule and a depth-based slippage model, never a flat-fee shortcut.
Execute the standing audit suite (shift-fill, causal recompute, random baseline) before trusting any result.
Retain long history. Practitioner guidance recommends five or more years of history, or a large enough event count, specifically because binary-outcome strategies need substantial sample sizes to separate genuine edge from noise.
Step | What it prevents |
|---|---|
Immutable episode ingestion | Silent data revision, look-ahead contamination |
Canonical IDs | Cross-venue join errors, duplicate market counting |
Point-in-time snapshots | Survivorship bias, retroactive metadata leaks |
Deterministic maker/taker replay | Inflated P&L from unrealistic fills |
Standing audit suite | Same-bar fills, centered-feature leaks |
5+ years / high event count | Statistically insignificant sample sizes |
How Assymetrix Supports Reproducible, Execution-Aware Backtests
Assymetrix maintains a historical backfill of roughly 1.5 terabytes spanning more than 900 million indexed events, with trade-level granularity across Polymarket, Kalshi, and Limitless going back to September 2020. That history includes over 200 million OHLCV snapshots sampled at 15-minute resolution, giving quants both a coarse index for scanning years of markets and the trade-level stream underneath for building execution-realistic fill models.
A typical workflow looks like this:
Pull an episode package for a target market window through the Data API, including metadata, orderbook snapshots, and trade prints.
Run the episode through a maker/taker replay configured with venue-specific fee schedules.
Compute fill ratio and fee-adjusted Sharpe ratio from the replay output, then compare against the constrained-random baseline before drawing any conclusion.
The same canonical ID structure that lets you join Polymarket and Kalshi markets for cross-venue arbitrage research also makes multi-venue backtests tractable without a separate reconciliation layer for each source. Developers building on Polymarket specifically can start with the Polymarket data resources before expanding a strategy across venues.
How Do You Clean and Preprocess Prediction Market Data?
Prediction market data carries three cleaning problems that standard financial time-series pipelines don’t anticipate. First, binary and multi-outcome markets often report price as an implied probability between 0 and 1, and mixing that convention with cents-based pricing from a different venue without normalizing first will silently corrupt any cross-venue feature.
Second, orderbook snapshots frequently contain phantom liquidity, resting orders that get pulled the instant they’d be filled. Filtering snapshots against realized trade prints, and discarding book levels that never once absorbed a fill during the observation window, removes most of this noise before it reaches your feature pipeline.
Third, timestamp alignment across venues is inconsistent. Some venues timestamp at order receipt, others at block confirmation for on-chain settlement, introducing skew of several seconds to minutes. Resample every venue’s stream to a common clock, typically UTC with millisecond precision, before joining across sources. Deduplicate trade prints that arrive twice under retries, using trade ID rather than timestamp plus price as the dedup key, since two genuine trades can share both.
Finally, treat resolved-but-uncorrected markets carefully: a settlement event that arrives, then gets amended hours later, needs both versions preserved rather than overwritten, so your point-in-time queries stay honest about what was actually knowable at each moment.
How Do You Engineer Features From Prediction Market Signals?
Feature engineering for prediction markets differs from equities in one structural way: price is bounded between 0 and 1, and it converges toward a known terminal value (0 or 1) as resolution approaches. That convergence dynamic should shape every feature you build.
Time-to-resolution features matter more here than in most asset classes. A market trading at 0.60 with three months left behaves very differently than the same price with three days left, so normalize momentum and volatility features by remaining time, not just by lookback window.
Order flow imbalance, the ratio of aggressive buy volume to aggressive sell volume over a rolling window, tends to carry more signal than raw price momentum in markets with sparse trading, since it captures conviction rather than noise from wide bid/ask spreads. Pair it with depth-based liquidity metrics so the feature accounts for how much size actually sits behind the imbalance.
Cross-venue divergence is a feature category unique to this asset class: the same event, priced simultaneously on Polymarket and Kalshi, occasionally diverges by several cents when liquidity is thin on one side. That spread, tracked as a rolling feature rather than a point-in-time snapshot, feeds directly into arbitrage-style signal construction.
Smart Money positioning, wallet-level accumulation patterns ahead of major price moves, works as a leading feature when computed causally: only count positions established before the timestamp your feature is evaluated at, never positions visible in hindsight.
Which Metrics Actually Evaluate a Prediction Market Backtest?
Accuracy alone is a poor metric for prediction market strategies, because a strategy that correctly calls 70% of markets can still lose money if its sizing is wrong on the 30% it misses. Profitability metrics need to sit alongside directional accuracy, not replace it.
Fee-adjusted Sharpe ratio should be computed after subtracting the maker/taker fees and slippage the replay engine actually charged, never on gross P&L. A strategy that looks strong before fees and mediocre after them is telling you its edge is too thin to survive real execution costs.
Fill ratio measures how much of your intended order size actually executed. A strategy backtested assuming full fills, then deployed live where it fills 40% of intended size, will behave nothing like its backtest.
Calibration error, the gap between a strategy’s implied probability and realized outcome frequency across many markets, is arguably the single most prediction-market-specific metric available, since it directly tests whether the strategy’s edge is genuine forecasting skill rather than lucky timing.
Maximum drawdown and per-episode P&L variance round out the set, particularly because prediction markets settle in discrete binary jumps rather than continuous price paths, so drawdown profiles look choppier than in traditional asset classes even when the underlying edge is real.
How Do You Handle Missing or Incomplete Historical Data?
Gaps in prediction market history come from three sources: venue API downtime, markets that launched and closed within the same data collection cycle, and orderbook snapshots that simply weren’t captured at the configured interval. Each needs a different fix.
For short gaps in continuous streams (a few minutes of missing trade prints), forward-filling the last known orderbook state is acceptable, but never forward-fill a settlement outcome, since that field should only ever populate at the moment resolution actually occurs.
For markets with sparse or no trade history during part of their lifecycle, resist the urge to interpolate a synthetic price. A flat, low-volume period is itself information, evidence that a market wasn’t attracting committed capital, and smoothing it away removes a genuine feature. Flag these periods explicitly with a low_liquidity indicator rather than disguising them.
For entirely missing markets, the ones that existed but were never captured by your ingestion pipeline, cross-check venue-published market lists against your own database periodically. A market absent from your archive but present in the venue’s own historical index is a coverage gap, not a resolved absence, and needs backfilling before you trust any universe-wide statistic drawn from that period.
Never drop incomplete markets from your universe purely for convenience. That’s the same mechanism that produces survivorship bias, just applied at the data-quality layer instead of the market-selection layer.
How Do You Model Market Impact and Liquidity in Backtests?
A backtest that fills every order at the quoted price regardless of size is measuring a strategy that can’t exist. Market impact modeling in prediction markets starts with top-N orderbook depth: for any intended order size, walk the book level by level and compute the volume-weighted average fill price rather than assuming a single quote.
For strategies sized larger than a market’s typical top-of-book depth, model partial fills explicitly, splitting an order across multiple simulated fills at successively worse prices, and log the realized slippage against the naive best-quote price so you know exactly how much impact cost your strategy is absorbing. Open interest and traded volume, key filters for separating committed capital from speculative noise, should gate which markets a strategy is even allowed to trade in backtest, matching whatever liquidity floor it would need to respect live.
A strategy that only works when it assumes unlimited liquidity at the quoted price will fail the moment it meets a real order book. Building this constraint into the replay engine from day one, rather than bolting it on after a naive backtest looks promising, is the difference between a strategy that survives deployment and one that doesn’t.
What Do Real Benchmark Strategy Backtests Look Like?
Three benchmark strategy types illustrate how the requirements above come together in practice.
A mean-reversion strategy on high open-interest markets enters when price deviates more than a fixed threshold from a volume-weighted moving average, exits on reversion or time decay near resolution. Its backtest setup requires trade-level prints for the moving average, orderbook depth for realistic entry fills, and an open-interest filter excluding thin markets, since mean reversion is fragile precisely where single positions can move price.
A cross-venue arbitrage strategy monitors the same canonical event priced on two venues simultaneously, entering when the spread exceeds combined fees plus estimated slippage. Its backtest setup demands synchronized, millisecond-aligned trade streams from both venues and a strict causal feature computation, since even a few seconds of look-ahead can manufacture an arbitrage opportunity that never actually existed.
A Smart Money following strategy tracks wallet-level accumulation ahead of resolution and takes positions in the same direction once accumulation crosses a threshold. Its backtest setup needs wallet-level fill data joined to trade prints, with strict point-in-time gating so the strategy never sees accumulation that happened after its decision timestamp. All three benchmarks should run through the same deterministic replay engine and the same standing audit suite described earlier, so results across strategy types are directly comparable.
What the Data Actually Tells You About Backtesting Discipline
The conventional advice on prediction market backtesting treats it like an extension of equities backtesting with a different price bound. That’s the wrong mental model. Equities backtests worry primarily about transaction costs and regime change. Prediction market backtests worry about something more structural: the outcome data itself arrives at a specific moment, and if your pipeline lets that moment bleed backward even slightly, your entire performance number is manufactured, not measured.
What’s underrated here is how cheap the fix actually is. A shift-fill test and a causal feature recompute take an afternoon to build and should run on every strategy before it’s trusted, yet most backtests skip both entirely. What’s overrated is chasing bigger feature sets before the replay engine itself is trustworthy. A sophisticated model built on top of a leaky simulator just produces a more convincing wrong answer.
If you take one thing from this guide, prioritize the harness before the strategy. Get deterministic, execution-aware replay working first, on a small dataset if necessary. Everything downstream, feature engineering, benchmark comparisons, live deployment confidence, depends on that foundation holding.
— Dean
Get Cross-Venue Historical Data for Your Next Backtest
Assymetrix gives quants the cross-venue infrastructure this guide describes without forcing a separate integration for each platform: normalized schemas, canonical market IDs, and episode-ready historical packages spanning Polymarket, Kalshi, and Limitless.
Instead of building three separate ingestion pipelines and reconciling schemas by hand, you get one integration covering trade-level fills, orderbook snapshots, and settlement events going back to September 2020, plus Smart Money wallet tracking already computed for you. The Data API documentation covers REST and WebSocket access, and subscription tiers scale from research-grade access up to full institutional bulk export, with current pricing listed on the site. Start by pulling a sample episode through the Data API landing page and running it through your own replay engine before committing to a larger backtest.
Sources
How Much Sharpe Does a Look-Ahead Leak Manufacture? A Controlled Study
Chapter 26: Backtesting Prediction Market Strategies | Prediction Markets
FAQ
What Is Point-in-Time Data and Why Does It Matter?
Point-in-time data records exactly what a market’s price, book, and metadata looked like at a specific historical moment, without later corrections or resolution outcomes bleeding backward. It’s the single most important safeguard against look-ahead bias, which can manufacture large, entirely fake performance gains in an otherwise plausible-looking backtest.
How Many Years of History Do I Need for a Valid Backtest?
Practitioner guidance recommends five or more years of history, or an equivalently large event count, for binary-outcome strategies to reach statistical significance. Shorter windows risk mistaking noise for genuine edge, especially on strategies with a small number of trades per year.
Can I Backtest Using Only On-Chain Data?
On-chain extraction works for venues that settle publicly, like Polymarket, and gives reliable trade and settlement records, but it typically lacks the orderbook depth needed for realistic fill modeling. Combining on-chain settlement data with a normalized orderbook feed, such as the one available through Assymetrix, gives a more complete picture than either source alone.
What’s the Biggest Data Mistake in Prediction Market Backtesting?
Same-bar fills, where a strategy fills at a price only observable after its decision was made, is the most common and most damaging mistake, and it can inflate measured Sharpe ratios dramatically. A shift-fill audit, delaying every fill by one bar and rechecking performance, catches this reliably.
Does Assymetrix Provide Trade-Level Data Across All Major Venues?
Assymetrix provides trade-level granularity across Polymarket, Kalshi, and Limitless dating back to September 2020, backed by roughly 1.5 terabytes of historical data and over 900 million indexed events. Current subscription pricing for the Data API is listed on the Assymetrix site.
Other Blog


