Polymarket Data Analysis for Quants and Developers
Polymarket Data Analysis for Quants and Developers
Polymarket Data Analysis for Quants and Developers
Unlock insights with accurate Polymarket data analysis. Discover real-time trading and powerful tools for quants and developers.

Polymarket Data Analysis for Quants and Developers
Rigorous Polymarket data analysis starts with two things: a ground-truth trade-direction source and a normalized historical store you can query reproducibly. The recommended stack combines Polymarket’s official REST and WebSocket endpoints for real-time ticks, the Polymarket-v1 archive for settlement-verified historical records, and a unified vendor API such as Assymetrix for cross-venue normalization and bulk Parquet exports. From there, the minimal pipeline is a streaming ingestion layer, a time-series store partitioned by market_id, and a compute layer (Python/Pandas for prototyping, Spark or Dask for scale).
Top sources at a glance:
Official Polymarket REST API — market metadata, last trade price, market list; low latency, limited historical depth
Polymarket WebSocket streams — real-time tick feed; suitable for live agents and alerting
On-chain settlement archives (Polymarket-v1) — Over one billion trades across more than one million markets with ground-truth buyer/seller direction; the authoritative source for benchmarking
Assymetrix Data API — unified real-time and historical access across Polymarket, Kalshi, and Limitless; normalized schema, L2 reconstruction, Smart Money signals, and bulk Parquet exports built on approximately 1.5 TB of historical data
Pro Tip: Prioritize settlement-layer trade direction when computing trader signals. Order-book reconstruction from settlement receipts outperforms tick-rule heuristics, which achieve near-random accuracy on Polymarket’s binary contract structure.
Table of Contents
Where do you get Polymarket data: endpoints, streaming, and bulk exports?
What normalized data model does Polymarket analysis require?
What core metrics should you compute for Polymarket analysis?
How do you track wallets and score trader skill on Polymarket?
Why does L2 order-book reconstruction matter, and how do you do it?
What do concrete Polymarket analysis queries and experiments look like?
What does a production-grade Polymarket integration stack look like?
What data quality, rate limits, and licensing issues should you plan for?
How do you build a reproducible Polymarket analysis pipeline?
Key Takeaways
The case for truth-aligned microstructure in prediction market research
Assymetrix gives you unified Polymarket data without the integration overhead
Useful sources and datasets to consult next
Where do you get Polymarket data: endpoints, streaming, and bulk exports?
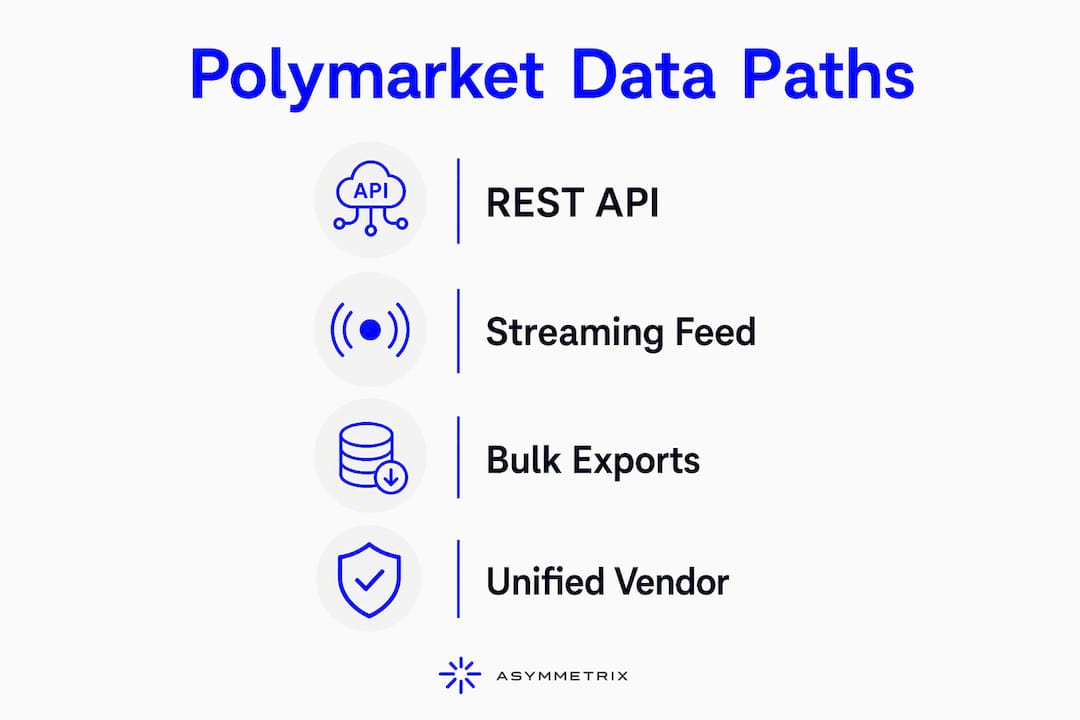
Three distinct ingestion paths exist, each with different latency, retention, and cost profiles.

Official Polymarket endpoints
The REST API exposes market metadata (question text, resolution criteria, token addresses), current order-book snapshots, and recent trade history. The WebSocket feed delivers real-time price ticks and order events with sub-second latency. Both are well-suited for live trading agents and alerting systems. The limitation is retention: the official API is built for live trading, not bulk export, so deep historical queries require pagination and aggressive caching.
On-chain settlement archives
The Polymarket-v1 archive contains 1.2 billion trades across 1.3 million markets, representing $61 billion in nominal volume, with ground-truth aggressor direction derived from on-chain settlement records. A separate community-built dataset documents 1.1 billion trading records across 268,000+ markets in analysis-ready Parquet format, including orderfilled.parquet (293 million raw blockchain events), quant.parquet (170 million clean trades normalized to YES perspective), and users.parquet (340 million maker/taker-split records). These archives are the right starting point for backtests and heuristic validation.
Unified vendor APIs
Assymetrix aggregates Polymarket, Kalshi, and Limitless into a single normalized data feed with consistent schema, L2 reconstruction, and bulk Parquet exports. For researchers who need cross-venue id mapping or Smart Money signals without building a multi-source ingestion pipeline from scratch, this is the practical path.
Source | Latency | Historical depth | Ground-truth direction | Best use case |
|---|---|---|---|---|
Polymarket REST API | ~1–5 s | Days to weeks | No | Live agents, metadata queries |
Polymarket WebSocket | Sub-second | None (streaming only) | No | Real-time alerting, tick capture |
Polymarket-v1 archive | Batch | Full history | Yes | Backtests, heuristic benchmarking |
Community Parquet datasets | Batch | Full history | Partial | Behavioral research, ML features |
Assymetrix Data API | Sub-second (real-time) + batch | ~1.5 TB historical | Yes (normalized) | Production pipelines, cross-venue research |
Key trade-offs:
Freshness vs. completeness: streaming feeds miss historical context; archives miss live events
Cost vs. convenience: raw on-chain ingestion is free but operationally expensive; vendor APIs trade cost for normalized, queryable data
Truth-aligned direction vs. heuristic-inferred direction: only settlement-layer sources give you verified maker/taker flags
Pro Tip: Before deploying any pipeline, run a small-sample reconciliation between your API feed and a Polymarket-v1 snapshot. Compare classified trade directions and timestamps on the same market window. Discrepancies above a few percent signal a normalization or timestamp-alignment problem.
What normalized data model does Polymarket analysis require?
A reproducible Polymarket schema needs at minimum these fields, stored in UTC with millisecond or nanosecond resolution:
Field | Type | Why it matters |
|---|---|---|
| string | Primary join key across all tables |
| string | YES/NO token identifier; normalize to YES perspective |
| — | Canonical timebase; nanosecond where available |
| float (0–1) | Normalize from 0–100 cent quotes to 0–1 probability |
| float | USD notional; filter contract-vs-user trades |
| enum (BUY/SELL) | Unified BUY direction (negative = selling) |
| enum | Critical for OFI, VPIN, TCA |
| string | Deduplication and fill matching |
| string | Trader-level analytics and Smart Money tracking |
| float | Spread computation |
| float | Spread computation |
| float | Net P&L calculation |
| — | Time-to-resolution features |
| enum (YES/NO/INVALID) | Ground-truth label for calibration |
Normalization checklist:
Convert all timestamps to UTC; reject any record where
timestamp_utcprecedes the market creation timestamp or exceeds the resolution timestamp.Scale prices to the 0–1 range. Polymarket quotes in cents (0–100); divide by 100 before storing.
Map all trades to YES-token perspective. The community
quant.parquetdataset does this transformation; replicate it in your own pipeline.Derive
maker_taker_flagfrom settlement-layer buyer/seller flags, not from tick-rule inference.Tag wallet addresses with bot/contract flags using known exchange contract addresses before computing trader-level metrics.
Store
resolution_outcomeas a join from the markets table, not as a field inferred from final price.
The maker_taker_flag deserves special attention. Deriving it from settlement events rather than heuristic inference is what separates valid OFI and VPIN estimates from noise. The next section explains why in detail.
What core metrics should you compute for Polymarket analysis?
Every quant working with Polymarket data needs a consistent metric set. The table below defines the primary signals, their formulas, and recommended aggregation windows.
Metric | Formula / definition | Aggregation | Signal type |
|---|---|---|---|
Implied probability |
| Per tick | Market state |
Log-odds |
| Per tick | Linearized probability |
Realized volatility |
| 1 h, 24 h | Uncertainty |
Signed volume |
| Per minute | Order flow |
OFI (order flow imbalance) | `Σ signed_volume / Σ | size | ` |
True VPIN | ` | buy_vol - sell_vol | / total_vol` using ground-truth direction |
Gibbs spread |
| Per snapshot | Friction / information |
Open interest |
| Per hour | Market depth |
Liquidity depth |
| Per snapshot | Execution cost |
Time-to-resolution |
| Per trade | Decay feature |
Interpretation notes:
OFI and True VPIN, computed with ground-truth maker/taker flags, are your primary informed-flow indicators. High sustained OFI in one direction before a price move is a Smart Money signal.
Gibbs spread width is an informational proxy. Markets with wider spreads often attract specialized, informed participants and can show lower forecast errors than their liquidity implies. Screen for high-spread markets before dismissing them as illiquid.
Raw volume is a weak signal on its own. An archived dataset of 19.1 million price snapshots across roughly 19,000 markets confirms that high-volume markets are typically the most efficient, not the most volatile. The violent re-pricings happen in thinner markets.
Time-to-resolution is underused. Most markets sit in a noisy band for the majority of their life and only converge in short bursts near the resolving event. A 60-cent market with three weeks left and a 60-cent market with three hours left are completely different objects from a modeling perspective.
Pro Tip: Treat spread width as a screening variable, not a filter. High-spread niche markets may have better forecasting performance precisely because the barrier to entry keeps noise traders out.
How do you track wallets and score trader skill on Polymarket?
Trader-level analytics require three layers: identity resolution, performance attribution, and bias control.
Signal definitions:
Smart Money wallets — repeat profitable wallets with concentrated, directional order flow ahead of price moves. Identify them by filtering for wallets with above-median OFI contribution and positive time-weighted P&L over a rolling 30-day window.
Engagement metrics — active trading days, number of distinct market categories traded, and average position size. These distinguish informed specialists from broad retail participants.
Skill score — Brier score improvement versus the market baseline (the closing price as a naive forecast), risk-adjusted for position size and normalized by the number of resolved markets traded.
Calculation pipeline:
Join
users.parquet(or equivalent) to the resolved markets table onmarket_id.For each wallet, compute time-weighted P&L: weight each position’s return by the fraction of the market’s life it was held.
Compute Brier improvement:
(market_Brier - wallet_Brier) / market_Brier. Positive values indicate the wallet forecasted better than the closing price.Apply a minimum-market threshold (at least 20 resolved markets) before ranking. Wallets with fewer observations have high variance scores that look like skill.
Normalize by ticket size to prevent large-capital wallets from dominating the leaderboard purely through volume.
Bias and data-quality warnings:
Nothing-Ever-Happens bias — a structural pattern documented in community analyses where many contracts resolve NO more often than intuition suggests. This inflates the apparent skill of wallets that systematically bet NO. Control for it by computing skill scores separately by market category and resolution direction.
Bot networks and wash trading — known exchange contract addresses generate fills that look like user trades. Filter them using the official contract address list before computing any wallet-level metric.
On-chain wallet reuse — sophisticated traders rotate wallets. Cross-venue identity matching (linking the same economic actor across Polymarket, Kalshi, and Limitless) requires address clustering heuristics and is an active research problem. Assymetrix surfaces cross-venue wallet analytics as part of its intelligence layer.
Survivorship bias — leaderboards built on resolved markets only show wallets that stayed active. Include wallets that exited early to avoid inflating the average skill score.
Why does L2 order-book reconstruction matter, and how do you do it?
The short answer: reconstruct L2 from timestamped order events and settlement receipts to recover true maker/taker roles. Everything downstream — VPIN, OFI, transaction cost analysis — depends on getting this right.
The reason standard heuristics fail on Polymarket is structural. Tick-rule and bulk-volume classifiers were designed for continuous equity markets with many participants and frequent price changes. Polymarket’s binary contracts trade at concentrated price levels (often near 0.50), generating long runs of zero-tick trades that the tick rule misclassifies in the same direction. The result is positive autocorrelation errors at round prices that propagate into every metric built on top.
The empirical evidence is stark. Benchmarked against the Polymarket-v1 archive ground truth:
The tick rule and bulk volume classification achieve accuracy near random chance across the full cross-section — statistically indistinguishable from random assignment, with systematic price-level biases that make the errors non-random and therefore non-canceling in aggregate metrics.
That means any VPIN or OFI series computed with tick-rule direction is not just noisy — it is systematically biased in a way that varies with price level. Signals built on it will appear to work in backtests and fail in production for reasons that are hard to diagnose.
L2 reconstruction checklist:
Ingest raw order messages (new order, cancel, fill) from the WebSocket feed or archive, preserving original message timestamps.
Deduplicate fills using
order_idandtransaction_hash. Duplicate events are common in replayed archives.Align fill timestamps to settlement events. Settlement receipts carry the canonical on-chain timestamp; use them to resolve ambiguous ordering.
Map each fill to maker/taker using the settlement-layer buyer/seller flags. The maker is the resting order; the taker is the aggressor.
Rebuild the order-book snapshot at each fill event: apply the fill, then apply any cancels with timestamps between the previous and current fill.
Compute Gibbs spread from the reconstructed top-of-book bid and ask at each snapshot.
Aggregate True VPIN over fixed-volume buckets using the ground-truth direction flags from step 4.
Pro Tip: Before using reconstructed VPIN or OFI for live signals, validate on a held-out historical sample from the Polymarket-v1 archive. Compare your derived values to the ground-truth classified metrics on the same market window. If correlation is below 0.90, your reconstruction has a timestamp-alignment or deduplication problem.
What do concrete Polymarket analysis queries and experiments look like?
The following examples assume a normalized Parquet store with the schema defined earlier. All code sketches use Python/Pandas; the same logic translates directly to SQL on ClickHouse or DuckDB.
Four analysis recipes:
Favorite-longshot calibration. Group resolved markets by their last pre-resolution price bucket (rounded to the nearest 0.10). Compare the bucket’s mean implied probability to its actual YES resolution rate. The 19.1 million snapshot archive shows contracts in the 2–10 cent band resolve YES less often than their price implies (the longshot tax), while contracts in the 90–98 cent band resolve YES slightly more often than priced.
Time-to-resolution decay cohorting. Bin trades by
resolution_timestamp - timestamp_utcinto cohorts (>30 days, 7–30 days, 1–7 days, <24 hours). Compute realized volatility per cohort. The result will show that most price movement concentrates in the final cohort, validating time-to-resolution as a primary modeling feature.Per-wallet skill score. Join the users table to resolved markets, compute Brier improvement per wallet per market, then aggregate with a minimum-20-market filter. Sort descending. The top decile is your Smart Money candidate list.
Liquidity-adjusted volatility screening. Compute
realized_volatility / liquidity_depthper market per day. Markets with high ratios are moving a lot relative to their depth — these are the ones where a single informed trade can shift the price materially.
Visualization recipes:
Calibration heatmap — x-axis: implied probability bucket; y-axis: actual resolution rate; color: sample size. Deviations from the diagonal are the longshot bias signal.
OFI time-series vs. news timestamps — overlay signed OFI on a price chart with vertical lines at known news events. Informed flow typically precedes price moves by minutes to hours.
Liquidity depth vs. realized slippage scatter — each point is a market; color by category. Thin markets cluster in the high-slippage region.
Backtest outline for a Smart Money-following strategy:
Entry: when a wallet in the top-decile skill leaderboard opens a new position, enter the same direction at the next available price. Exit at resolution or at a fixed time-to-resolution threshold (e.g., 48 hours before close). Execution model: assume 1–2 cent slippage on entry and exit. Evaluation: Brier score improvement vs. the market baseline, edge after transaction costs, and Sharpe ratio over resolved markets. For reproducible backtesting examples using large price-snapshot archives, the Assymetrix blog provides runnable notebooks.
Pro Tip: Bootstrap confidence intervals using market-level resampling, not per-trade resampling. Trades within the same market are correlated; treating them as independent observations inflates your effective sample size and makes weak signals look statistically significant.
What does a production-grade Polymarket integration stack look like?
A production stack has five layers. The right choice at each layer depends on whether you are prototyping or running a live agent.
Stack components:
Streaming layer — Kafka or a managed stream (AWS Kinesis, Confluent Cloud) for durable, replayable tick capture. Durable offsets are non-negotiable: you need to replay from any point without re-querying the API.
Ingestion — a WebSocket connector that writes raw messages to the stream, plus a webhook reconciliation job that catches any gaps by polling the REST API on a fixed cadence.
Time-series store — ClickHouse or TimescaleDB for hot data (last 90 days); Parquet lake (S3 or GCS) for cold historical data. Partition cold Parquet by
resolution_datefor efficient cohort queries.Compute — single-node Python/Pandas for prototyping and signal research; Spark or Dask for full-history scans. DuckDB is a strong middle option for querying Parquet directly without a cluster.
Visualization and monitoring — Apache Superset or Grafana for operational dashboards; Observable notebooks for research visualization.
SDK and feature checklist for any vendor API you evaluate:
Durable offsets and replayability from a named checkpoint
Bulk export support in Parquet format with consistent schema versioning
Ground-truth maker/taker flags (not tick-rule inferred)
Cross-venue
market_idmapping for Polymarket, Kalshi, and LimitlessPython SDK with documented rate limits and retry semantics
Backfill strategy:
Start from the bulk Parquet export to populate the historical store
Run an incremental reconcile job that replays the stream from the export’s end timestamp
Validate completeness with checksum tests: compare daily trade counts in the Parquet store to the API’s reported daily volume
Pro Tip: Shard your hot store by market_id, not by date. Most queries filter on a specific market first, then on time. A date-first partition forces a full scan across all markets for any per-market query.
What data quality, rate limits, and licensing issues should you plan for?
Operational risk checklist:
Timestamp skew — WebSocket timestamps reflect server receipt time, not on-chain confirmation time. For microstructure analysis, always reconcile to settlement-layer timestamps.
Snapshot cadence gaps — 15-minute snapshot archives miss intra-period price moves. For volatility and OFI computation, use tick-level data, not snapshot data.
Missing settlement receipts — some markets resolve with delayed or ambiguous settlement events. Flag these with a
resolution_status = PENDINGfield and exclude them from calibration analyses until confirmed.Washed and bot-driven flows — Polymarket processed tens of billions in volume in March with over one million active wallets, predominantly retail-sized trades. High aggregate volume does not guarantee informed flow. Filter known contract addresses and apply minimum-trade-size thresholds before computing Smart Money signals.
Ambiguous resolutions — markets that resolve INVALID or are disputed require separate handling. Include a
resolution_outcomefield with an INVALID enum value and exclude these markets from Brier score calculations.
Rate-limit handling:
Implement exponential backoff with jitter on all REST calls. Start at 1 second, cap at 60 seconds.
Use idempotent replay tokens on WebSocket reconnects to avoid duplicate event processing.
Maintain a prioritized subscription list: subscribe to high-volume or high-OFI markets first when WebSocket connection slots are limited.
Licensing:
Public data scraping is legally distinct from using the official API under Polymarket’s terms of service, which in turn differs from a commercial data license through a vendor. For production commercial use, a vendor license (such as Assymetrix’s commercial tier) typically provides cleaner terms, SLA guarantees, and indemnification that raw scraping does not.
Observability: Set SLA monitors on three metrics: ingestion lag (alert if the stream falls more than 30 seconds behind), reconciliation mismatch rate (alert if more than 0.1% of daily trades differ between the stream and the REST reconcile job), and daily data completeness (alert if any market with open interest shows zero trades for more than 2 hours during active trading hours).
How do you build a reproducible Polymarket analysis pipeline?
Reproducibility in prediction market research is harder than in equity research because the data sources are less standardized and the ground-truth labels (resolution outcomes) arrive asynchronously.
Reproducibility checklist:
Fix random seeds in all sampling, bootstrapping, and train/test split operations. Store the seed in the experiment config file.
Capture the full environment:
requirements.txtor a pinnedcondaenvironment, plus a Docker container for production runs.Use immutable snapshots for backtests. Never run a backtest against a live-updating dataset. Export a versioned Parquet snapshot at the start of each experiment and reference it by hash.
Version all Parquet exports with a schema version field. When you add or rename a column, increment the version and update the reader accordingly.
Log every derived metric computation with its input dataset hash, code version, and timestamp.
Test-case examples:
Unit test for order-book reconstruction: given a synthetic sequence of order events with known maker/taker assignments, assert that the reconstructed book matches the expected state at each step.
End-to-end validation: on a held-out sample from the Polymarket-v1 archive, compute VPIN using your reconstruction pipeline and compare to the ground-truth classified VPIN. Assert correlation above 0.90.
Regression test for metric drift: re-run the calibration analysis on a fixed historical snapshot weekly. Alert if the favorite-longshot bias coefficient shifts by more than 10% from the baseline.
Statistical validation steps:
Out-of-sample backtests: train signal parameters on markets resolved before a cutoff date; evaluate on markets resolved after.
Cross-validate by market cohort (politics, sports, economics) to confirm signals generalize across categories, not just the dominant category.
Apply multiple-comparison corrections (Bonferroni or Benjamini-Hochberg) when testing more than five signals simultaneously. Prediction market datasets are large enough to find spurious correlations at standard significance thresholds.
Sensitivity analysis: vary tick-size rounding assumptions and price-bucket widths. A signal that disappears when you change the bucket width from 0.05 to 0.10 is not robust.
Key Takeaways
Rigorous Polymarket data analysis requires ground-truth trade direction, a normalized schema, and reproducible validation against archived settlement records before any signal goes to production.
Point | Details |
|---|---|
Use ground-truth direction | Tick-rule classifiers achieve ~50% accuracy on Polymarket; use settlement-layer maker/taker flags for valid OFI and VPIN. |
Combine streams with history | Pair real-time WebSocket feeds with bulk Parquet archives to cover both live signals and reproducible backtests. |
Time-to-resolution is a primary feature | Most price movement concentrates in short bursts near resolution; cohort by time-to-resolution before modeling price dynamics. |
Treat spread width as informational | High-spread niche markets often attract specialized participants and can show lower forecast errors than their liquidity implies. |
Assymetrix for unified access | Assymetrix provides normalized real-time and historical data across Polymarket, Kalshi, and Limitless, with ground-truth direction, Smart Money tracking, and bulk Parquet exports built on approximately 1.5 TB of historical data. |
The case for truth-aligned microstructure in prediction market research
The most common mistake in prediction market research is borrowing equity-market assumptions wholesale. Tick rules, bulk-volume classifiers, and VWAP-based benchmarks were built for markets with continuous price discovery and many competing market makers. Polymarket’s binary structure, concentrated liquidity, and zero-tick clustering at round prices break every one of those assumptions.
The Polymarket-v1 archive makes this concrete: tick-rule accuracy of 49.83% is not a rounding error or a data-quality problem. It is a structural property of the market. Any research pipeline that ignores this and uses heuristic direction will produce metrics that look coherent in isolation but are systematically biased in ways that only become visible when you compare them to ground truth.
The practical implication is that the barrier to doing this correctly is lower than it appears. The settlement-layer data is public. The reconstruction logic is straightforward once you have the right archive. The hard part is knowing that the problem exists in the first place, and then building the discipline to validate every derived metric against ground truth before trusting it.
Cross-venue normalization adds a second layer of complexity that most single-venue analyses skip entirely. A Smart Money wallet active on both Polymarket and Kalshi looks like two separate actors in a single-venue dataset. The signal from their combined position is stronger than either venue shows alone. That is the analytical gap that unified intelligence platforms are designed to close.
Assymetrix gives you unified Polymarket data without the integration overhead
The problems this article covers — ground-truth trade direction, normalized schemas, cross-venue wallet tracking, and reproducible bulk exports — are exactly what Assymetrix is built to solve. Rather than maintaining separate ingestion pipelines for Polymarket, Kalshi, and Limitless, you get a single real-time and historical data API with consistent field names, settlement-verified maker/taker flags, and L2 reconstruction already done.

The platform surfaces Smart Money wallet tracking, Trader Skill Scores, and cross-venue arbitrage signals on top of approximately 1.5 TB of historical data spanning nearly one billion rows of trading activity. Bulk Parquet exports are available for backtesting pipelines, and Python SDK examples cover everything from streaming ingestion to per-wallet skill score computation. For researchers building reproducible backtesting workflows, Assymetrix offers non-commercial and academic tiers alongside commercial licenses for production deployments. Start at data.assymetrix.com to review available tiers and request API access.
Useful sources and datasets to consult next
Primary datasets and archives:
Polymarket-v1 archive (arXiv) — 1.2 billion trades across 1.3 million markets, $61 billion nominal volume, ground-truth direction, the authoritative benchmark for heuristic validation. Read this first.
SII-WANGZJ/Polymarket_data (GitHub) — 1.1 billion records in five analysis-ready Parquet formats including
quant.parquetandusers.parquet. Useful for behavioral and ML research.19.1 million snapshot archive (DEV Community) — 15-minute cadence across ~19,000 resolved markets; best for calibration and time-to-resolution analysis.
Documentation and integration guides:
Assymetrix Data API guide — real-time and historical endpoints, schema reference, and rate-limit specs.
Python SDK examples — ingestion code, wallet analytics, and signal computation notebooks.
Backtesting guide with 200M+ snapshots — reproducible experiment templates and API integration examples.
Recommended reading order: Start with the Polymarket-v1 archive paper to understand ground-truth direction and heuristic failure modes. Then read the ingestion documentation for your chosen data source. Then run the calibration and time-to-resolution analyses on a small resolved-market sample before building any live signal.
Citing datasets: When publishing research that uses the Polymarket-v1 archive or community Parquet datasets, cite the specific dataset version and the date of your export snapshot. For large archived Parquet exports, contact the dataset maintainers directly for access terms and versioning information.
FAQ
What is the most reliable source for Polymarket trade direction?
The Polymarket-v1 archive provides ground-truth buyer/seller direction derived from on-chain settlement records across 1.2 billion trades. Tick-rule heuristics achieve only ~50% accuracy on Polymarket and should not be used for OFI or VPIN computation.
How do you identify Smart Money wallets on Polymarket?
Filter for wallets with positive Brier score improvement versus the market baseline over at least 20 resolved markets, combined with above-median directional OFI contribution. Apply a minimum-market threshold and normalize by ticket size to control for capital-size effects.
What Python tools work best for Polymarket data analysis?
Pandas and DuckDB handle most research-scale Parquet queries efficiently. For production pipelines, ClickHouse or TimescaleDB serve as the hot store, with Spark or Dask for full-history scans. The Assymetrix Python SDK provides pre-built connectors for streaming ingestion and wallet analytics.
What is the Nothing-Ever-Happens bias in Polymarket data?
It is a structural pattern where many binary contracts resolve NO more often than intuition suggests, inflating the apparent skill of wallets that systematically bet NO. Control for it by computing skill scores separately by market category and resolution direction rather than pooling all markets.
How should you validate a Polymarket trading signal before going live?
Run an out-of-sample backtest on markets resolved after your training cutoff, apply market-level bootstrap resampling for confidence intervals, and compare derived VPIN or OFI values to ground-truth values from the Polymarket-v1 archive on a held-out sample. A correlation below 0.90 between your reconstructed metrics and ground truth indicates a pipeline problem that will corrupt live signals.
Polymarket Data Analysis for Quants and Developers
Rigorous Polymarket data analysis starts with two things: a ground-truth trade-direction source and a normalized historical store you can query reproducibly. The recommended stack combines Polymarket’s official REST and WebSocket endpoints for real-time ticks, the Polymarket-v1 archive for settlement-verified historical records, and a unified vendor API such as Assymetrix for cross-venue normalization and bulk Parquet exports. From there, the minimal pipeline is a streaming ingestion layer, a time-series store partitioned by market_id, and a compute layer (Python/Pandas for prototyping, Spark or Dask for scale).
Top sources at a glance:
Official Polymarket REST API — market metadata, last trade price, market list; low latency, limited historical depth
Polymarket WebSocket streams — real-time tick feed; suitable for live agents and alerting
On-chain settlement archives (Polymarket-v1) — Over one billion trades across more than one million markets with ground-truth buyer/seller direction; the authoritative source for benchmarking
Assymetrix Data API — unified real-time and historical access across Polymarket, Kalshi, and Limitless; normalized schema, L2 reconstruction, Smart Money signals, and bulk Parquet exports built on approximately 1.5 TB of historical data
Pro Tip: Prioritize settlement-layer trade direction when computing trader signals. Order-book reconstruction from settlement receipts outperforms tick-rule heuristics, which achieve near-random accuracy on Polymarket’s binary contract structure.
Table of Contents
Where do you get Polymarket data: endpoints, streaming, and bulk exports?
What normalized data model does Polymarket analysis require?
What core metrics should you compute for Polymarket analysis?
How do you track wallets and score trader skill on Polymarket?
Why does L2 order-book reconstruction matter, and how do you do it?
What do concrete Polymarket analysis queries and experiments look like?
What does a production-grade Polymarket integration stack look like?
What data quality, rate limits, and licensing issues should you plan for?
How do you build a reproducible Polymarket analysis pipeline?
Key Takeaways
The case for truth-aligned microstructure in prediction market research
Assymetrix gives you unified Polymarket data without the integration overhead
Useful sources and datasets to consult next
Where do you get Polymarket data: endpoints, streaming, and bulk exports?
Three distinct ingestion paths exist, each with different latency, retention, and cost profiles.
Official Polymarket endpoints
The REST API exposes market metadata (question text, resolution criteria, token addresses), current order-book snapshots, and recent trade history. The WebSocket feed delivers real-time price ticks and order events with sub-second latency. Both are well-suited for live trading agents and alerting systems. The limitation is retention: the official API is built for live trading, not bulk export, so deep historical queries require pagination and aggressive caching.
On-chain settlement archives
The Polymarket-v1 archive contains 1.2 billion trades across 1.3 million markets, representing $61 billion in nominal volume, with ground-truth aggressor direction derived from on-chain settlement records. A separate community-built dataset documents 1.1 billion trading records across 268,000+ markets in analysis-ready Parquet format, including orderfilled.parquet (293 million raw blockchain events), quant.parquet (170 million clean trades normalized to YES perspective), and users.parquet (340 million maker/taker-split records). These archives are the right starting point for backtests and heuristic validation.
Unified vendor APIs
Assymetrix aggregates Polymarket, Kalshi, and Limitless into a single normalized data feed with consistent schema, L2 reconstruction, and bulk Parquet exports. For researchers who need cross-venue id mapping or Smart Money signals without building a multi-source ingestion pipeline from scratch, this is the practical path.
Source | Latency | Historical depth | Ground-truth direction | Best use case |
|---|---|---|---|---|
Polymarket REST API | ~1–5 s | Days to weeks | No | Live agents, metadata queries |
Polymarket WebSocket | Sub-second | None (streaming only) | No | Real-time alerting, tick capture |
Polymarket-v1 archive | Batch | Full history | Yes | Backtests, heuristic benchmarking |
Community Parquet datasets | Batch | Full history | Partial | Behavioral research, ML features |
Assymetrix Data API | Sub-second (real-time) + batch | ~1.5 TB historical | Yes (normalized) | Production pipelines, cross-venue research |
Key trade-offs:
Freshness vs. completeness: streaming feeds miss historical context; archives miss live events
Cost vs. convenience: raw on-chain ingestion is free but operationally expensive; vendor APIs trade cost for normalized, queryable data
Truth-aligned direction vs. heuristic-inferred direction: only settlement-layer sources give you verified maker/taker flags
Pro Tip: Before deploying any pipeline, run a small-sample reconciliation between your API feed and a Polymarket-v1 snapshot. Compare classified trade directions and timestamps on the same market window. Discrepancies above a few percent signal a normalization or timestamp-alignment problem.
What normalized data model does Polymarket analysis require?
A reproducible Polymarket schema needs at minimum these fields, stored in UTC with millisecond or nanosecond resolution:
Field | Type | Why it matters |
|---|---|---|
| string | Primary join key across all tables |
| string | YES/NO token identifier; normalize to YES perspective |
| — | Canonical timebase; nanosecond where available |
| float (0–1) | Normalize from 0–100 cent quotes to 0–1 probability |
| float | USD notional; filter contract-vs-user trades |
| enum (BUY/SELL) | Unified BUY direction (negative = selling) |
| enum | Critical for OFI, VPIN, TCA |
| string | Deduplication and fill matching |
| string | Trader-level analytics and Smart Money tracking |
| float | Spread computation |
| float | Spread computation |
| float | Net P&L calculation |
| — | Time-to-resolution features |
| enum (YES/NO/INVALID) | Ground-truth label for calibration |
Normalization checklist:
Convert all timestamps to UTC; reject any record where
timestamp_utcprecedes the market creation timestamp or exceeds the resolution timestamp.Scale prices to the 0–1 range. Polymarket quotes in cents (0–100); divide by 100 before storing.
Map all trades to YES-token perspective. The community
quant.parquetdataset does this transformation; replicate it in your own pipeline.Derive
maker_taker_flagfrom settlement-layer buyer/seller flags, not from tick-rule inference.Tag wallet addresses with bot/contract flags using known exchange contract addresses before computing trader-level metrics.
Store
resolution_outcomeas a join from the markets table, not as a field inferred from final price.
The maker_taker_flag deserves special attention. Deriving it from settlement events rather than heuristic inference is what separates valid OFI and VPIN estimates from noise. The next section explains why in detail.
What core metrics should you compute for Polymarket analysis?
Every quant working with Polymarket data needs a consistent metric set. The table below defines the primary signals, their formulas, and recommended aggregation windows.
Metric | Formula / definition | Aggregation | Signal type |
|---|---|---|---|
Implied probability |
| Per tick | Market state |
Log-odds |
| Per tick | Linearized probability |
Realized volatility |
| 1 h, 24 h | Uncertainty |
Signed volume |
| Per minute | Order flow |
OFI (order flow imbalance) | `Σ signed_volume / Σ | size | ` |
True VPIN | ` | buy_vol - sell_vol | / total_vol` using ground-truth direction |
Gibbs spread |
| Per snapshot | Friction / information |
Open interest |
| Per hour | Market depth |
Liquidity depth |
| Per snapshot | Execution cost |
Time-to-resolution |
| Per trade | Decay feature |
Interpretation notes:
OFI and True VPIN, computed with ground-truth maker/taker flags, are your primary informed-flow indicators. High sustained OFI in one direction before a price move is a Smart Money signal.
Gibbs spread width is an informational proxy. Markets with wider spreads often attract specialized, informed participants and can show lower forecast errors than their liquidity implies. Screen for high-spread markets before dismissing them as illiquid.
Raw volume is a weak signal on its own. An archived dataset of 19.1 million price snapshots across roughly 19,000 markets confirms that high-volume markets are typically the most efficient, not the most volatile. The violent re-pricings happen in thinner markets.
Time-to-resolution is underused. Most markets sit in a noisy band for the majority of their life and only converge in short bursts near the resolving event. A 60-cent market with three weeks left and a 60-cent market with three hours left are completely different objects from a modeling perspective.
Pro Tip: Treat spread width as a screening variable, not a filter. High-spread niche markets may have better forecasting performance precisely because the barrier to entry keeps noise traders out.
How do you track wallets and score trader skill on Polymarket?
Trader-level analytics require three layers: identity resolution, performance attribution, and bias control.
Signal definitions:
Smart Money wallets — repeat profitable wallets with concentrated, directional order flow ahead of price moves. Identify them by filtering for wallets with above-median OFI contribution and positive time-weighted P&L over a rolling 30-day window.
Engagement metrics — active trading days, number of distinct market categories traded, and average position size. These distinguish informed specialists from broad retail participants.
Skill score — Brier score improvement versus the market baseline (the closing price as a naive forecast), risk-adjusted for position size and normalized by the number of resolved markets traded.
Calculation pipeline:
Join
users.parquet(or equivalent) to the resolved markets table onmarket_id.For each wallet, compute time-weighted P&L: weight each position’s return by the fraction of the market’s life it was held.
Compute Brier improvement:
(market_Brier - wallet_Brier) / market_Brier. Positive values indicate the wallet forecasted better than the closing price.Apply a minimum-market threshold (at least 20 resolved markets) before ranking. Wallets with fewer observations have high variance scores that look like skill.
Normalize by ticket size to prevent large-capital wallets from dominating the leaderboard purely through volume.
Bias and data-quality warnings:
Nothing-Ever-Happens bias — a structural pattern documented in community analyses where many contracts resolve NO more often than intuition suggests. This inflates the apparent skill of wallets that systematically bet NO. Control for it by computing skill scores separately by market category and resolution direction.
Bot networks and wash trading — known exchange contract addresses generate fills that look like user trades. Filter them using the official contract address list before computing any wallet-level metric.
On-chain wallet reuse — sophisticated traders rotate wallets. Cross-venue identity matching (linking the same economic actor across Polymarket, Kalshi, and Limitless) requires address clustering heuristics and is an active research problem. Assymetrix surfaces cross-venue wallet analytics as part of its intelligence layer.
Survivorship bias — leaderboards built on resolved markets only show wallets that stayed active. Include wallets that exited early to avoid inflating the average skill score.
Why does L2 order-book reconstruction matter, and how do you do it?
The short answer: reconstruct L2 from timestamped order events and settlement receipts to recover true maker/taker roles. Everything downstream — VPIN, OFI, transaction cost analysis — depends on getting this right.
The reason standard heuristics fail on Polymarket is structural. Tick-rule and bulk-volume classifiers were designed for continuous equity markets with many participants and frequent price changes. Polymarket’s binary contracts trade at concentrated price levels (often near 0.50), generating long runs of zero-tick trades that the tick rule misclassifies in the same direction. The result is positive autocorrelation errors at round prices that propagate into every metric built on top.
The empirical evidence is stark. Benchmarked against the Polymarket-v1 archive ground truth:
The tick rule and bulk volume classification achieve accuracy near random chance across the full cross-section — statistically indistinguishable from random assignment, with systematic price-level biases that make the errors non-random and therefore non-canceling in aggregate metrics.
That means any VPIN or OFI series computed with tick-rule direction is not just noisy — it is systematically biased in a way that varies with price level. Signals built on it will appear to work in backtests and fail in production for reasons that are hard to diagnose.
L2 reconstruction checklist:
Ingest raw order messages (new order, cancel, fill) from the WebSocket feed or archive, preserving original message timestamps.
Deduplicate fills using
order_idandtransaction_hash. Duplicate events are common in replayed archives.Align fill timestamps to settlement events. Settlement receipts carry the canonical on-chain timestamp; use them to resolve ambiguous ordering.
Map each fill to maker/taker using the settlement-layer buyer/seller flags. The maker is the resting order; the taker is the aggressor.
Rebuild the order-book snapshot at each fill event: apply the fill, then apply any cancels with timestamps between the previous and current fill.
Compute Gibbs spread from the reconstructed top-of-book bid and ask at each snapshot.
Aggregate True VPIN over fixed-volume buckets using the ground-truth direction flags from step 4.
Pro Tip: Before using reconstructed VPIN or OFI for live signals, validate on a held-out historical sample from the Polymarket-v1 archive. Compare your derived values to the ground-truth classified metrics on the same market window. If correlation is below 0.90, your reconstruction has a timestamp-alignment or deduplication problem.
What do concrete Polymarket analysis queries and experiments look like?
The following examples assume a normalized Parquet store with the schema defined earlier. All code sketches use Python/Pandas; the same logic translates directly to SQL on ClickHouse or DuckDB.
Four analysis recipes:
Favorite-longshot calibration. Group resolved markets by their last pre-resolution price bucket (rounded to the nearest 0.10). Compare the bucket’s mean implied probability to its actual YES resolution rate. The 19.1 million snapshot archive shows contracts in the 2–10 cent band resolve YES less often than their price implies (the longshot tax), while contracts in the 90–98 cent band resolve YES slightly more often than priced.
Time-to-resolution decay cohorting. Bin trades by
resolution_timestamp - timestamp_utcinto cohorts (>30 days, 7–30 days, 1–7 days, <24 hours). Compute realized volatility per cohort. The result will show that most price movement concentrates in the final cohort, validating time-to-resolution as a primary modeling feature.Per-wallet skill score. Join the users table to resolved markets, compute Brier improvement per wallet per market, then aggregate with a minimum-20-market filter. Sort descending. The top decile is your Smart Money candidate list.
Liquidity-adjusted volatility screening. Compute
realized_volatility / liquidity_depthper market per day. Markets with high ratios are moving a lot relative to their depth — these are the ones where a single informed trade can shift the price materially.
Visualization recipes:
Calibration heatmap — x-axis: implied probability bucket; y-axis: actual resolution rate; color: sample size. Deviations from the diagonal are the longshot bias signal.
OFI time-series vs. news timestamps — overlay signed OFI on a price chart with vertical lines at known news events. Informed flow typically precedes price moves by minutes to hours.
Liquidity depth vs. realized slippage scatter — each point is a market; color by category. Thin markets cluster in the high-slippage region.
Backtest outline for a Smart Money-following strategy:
Entry: when a wallet in the top-decile skill leaderboard opens a new position, enter the same direction at the next available price. Exit at resolution or at a fixed time-to-resolution threshold (e.g., 48 hours before close). Execution model: assume 1–2 cent slippage on entry and exit. Evaluation: Brier score improvement vs. the market baseline, edge after transaction costs, and Sharpe ratio over resolved markets. For reproducible backtesting examples using large price-snapshot archives, the Assymetrix blog provides runnable notebooks.
Pro Tip: Bootstrap confidence intervals using market-level resampling, not per-trade resampling. Trades within the same market are correlated; treating them as independent observations inflates your effective sample size and makes weak signals look statistically significant.
What does a production-grade Polymarket integration stack look like?
A production stack has five layers. The right choice at each layer depends on whether you are prototyping or running a live agent.
Stack components:
Streaming layer — Kafka or a managed stream (AWS Kinesis, Confluent Cloud) for durable, replayable tick capture. Durable offsets are non-negotiable: you need to replay from any point without re-querying the API.
Ingestion — a WebSocket connector that writes raw messages to the stream, plus a webhook reconciliation job that catches any gaps by polling the REST API on a fixed cadence.
Time-series store — ClickHouse or TimescaleDB for hot data (last 90 days); Parquet lake (S3 or GCS) for cold historical data. Partition cold Parquet by
resolution_datefor efficient cohort queries.Compute — single-node Python/Pandas for prototyping and signal research; Spark or Dask for full-history scans. DuckDB is a strong middle option for querying Parquet directly without a cluster.
Visualization and monitoring — Apache Superset or Grafana for operational dashboards; Observable notebooks for research visualization.
SDK and feature checklist for any vendor API you evaluate:
Durable offsets and replayability from a named checkpoint
Bulk export support in Parquet format with consistent schema versioning
Ground-truth maker/taker flags (not tick-rule inferred)
Cross-venue
market_idmapping for Polymarket, Kalshi, and LimitlessPython SDK with documented rate limits and retry semantics
Backfill strategy:
Start from the bulk Parquet export to populate the historical store
Run an incremental reconcile job that replays the stream from the export’s end timestamp
Validate completeness with checksum tests: compare daily trade counts in the Parquet store to the API’s reported daily volume
Pro Tip: Shard your hot store by market_id, not by date. Most queries filter on a specific market first, then on time. A date-first partition forces a full scan across all markets for any per-market query.
What data quality, rate limits, and licensing issues should you plan for?
Operational risk checklist:
Timestamp skew — WebSocket timestamps reflect server receipt time, not on-chain confirmation time. For microstructure analysis, always reconcile to settlement-layer timestamps.
Snapshot cadence gaps — 15-minute snapshot archives miss intra-period price moves. For volatility and OFI computation, use tick-level data, not snapshot data.
Missing settlement receipts — some markets resolve with delayed or ambiguous settlement events. Flag these with a
resolution_status = PENDINGfield and exclude them from calibration analyses until confirmed.Washed and bot-driven flows — Polymarket processed tens of billions in volume in March with over one million active wallets, predominantly retail-sized trades. High aggregate volume does not guarantee informed flow. Filter known contract addresses and apply minimum-trade-size thresholds before computing Smart Money signals.
Ambiguous resolutions — markets that resolve INVALID or are disputed require separate handling. Include a
resolution_outcomefield with an INVALID enum value and exclude these markets from Brier score calculations.
Rate-limit handling:
Implement exponential backoff with jitter on all REST calls. Start at 1 second, cap at 60 seconds.
Use idempotent replay tokens on WebSocket reconnects to avoid duplicate event processing.
Maintain a prioritized subscription list: subscribe to high-volume or high-OFI markets first when WebSocket connection slots are limited.
Licensing:
Public data scraping is legally distinct from using the official API under Polymarket’s terms of service, which in turn differs from a commercial data license through a vendor. For production commercial use, a vendor license (such as Assymetrix’s commercial tier) typically provides cleaner terms, SLA guarantees, and indemnification that raw scraping does not.
Observability: Set SLA monitors on three metrics: ingestion lag (alert if the stream falls more than 30 seconds behind), reconciliation mismatch rate (alert if more than 0.1% of daily trades differ between the stream and the REST reconcile job), and daily data completeness (alert if any market with open interest shows zero trades for more than 2 hours during active trading hours).
How do you build a reproducible Polymarket analysis pipeline?
Reproducibility in prediction market research is harder than in equity research because the data sources are less standardized and the ground-truth labels (resolution outcomes) arrive asynchronously.
Reproducibility checklist:
Fix random seeds in all sampling, bootstrapping, and train/test split operations. Store the seed in the experiment config file.
Capture the full environment:
requirements.txtor a pinnedcondaenvironment, plus a Docker container for production runs.Use immutable snapshots for backtests. Never run a backtest against a live-updating dataset. Export a versioned Parquet snapshot at the start of each experiment and reference it by hash.
Version all Parquet exports with a schema version field. When you add or rename a column, increment the version and update the reader accordingly.
Log every derived metric computation with its input dataset hash, code version, and timestamp.
Test-case examples:
Unit test for order-book reconstruction: given a synthetic sequence of order events with known maker/taker assignments, assert that the reconstructed book matches the expected state at each step.
End-to-end validation: on a held-out sample from the Polymarket-v1 archive, compute VPIN using your reconstruction pipeline and compare to the ground-truth classified VPIN. Assert correlation above 0.90.
Regression test for metric drift: re-run the calibration analysis on a fixed historical snapshot weekly. Alert if the favorite-longshot bias coefficient shifts by more than 10% from the baseline.
Statistical validation steps:
Out-of-sample backtests: train signal parameters on markets resolved before a cutoff date; evaluate on markets resolved after.
Cross-validate by market cohort (politics, sports, economics) to confirm signals generalize across categories, not just the dominant category.
Apply multiple-comparison corrections (Bonferroni or Benjamini-Hochberg) when testing more than five signals simultaneously. Prediction market datasets are large enough to find spurious correlations at standard significance thresholds.
Sensitivity analysis: vary tick-size rounding assumptions and price-bucket widths. A signal that disappears when you change the bucket width from 0.05 to 0.10 is not robust.
Key Takeaways
Rigorous Polymarket data analysis requires ground-truth trade direction, a normalized schema, and reproducible validation against archived settlement records before any signal goes to production.
Point | Details |
|---|---|
Use ground-truth direction | Tick-rule classifiers achieve ~50% accuracy on Polymarket; use settlement-layer maker/taker flags for valid OFI and VPIN. |
Combine streams with history | Pair real-time WebSocket feeds with bulk Parquet archives to cover both live signals and reproducible backtests. |
Time-to-resolution is a primary feature | Most price movement concentrates in short bursts near resolution; cohort by time-to-resolution before modeling price dynamics. |
Treat spread width as informational | High-spread niche markets often attract specialized participants and can show lower forecast errors than their liquidity implies. |
Assymetrix for unified access | Assymetrix provides normalized real-time and historical data across Polymarket, Kalshi, and Limitless, with ground-truth direction, Smart Money tracking, and bulk Parquet exports built on approximately 1.5 TB of historical data. |
The case for truth-aligned microstructure in prediction market research
The most common mistake in prediction market research is borrowing equity-market assumptions wholesale. Tick rules, bulk-volume classifiers, and VWAP-based benchmarks were built for markets with continuous price discovery and many competing market makers. Polymarket’s binary structure, concentrated liquidity, and zero-tick clustering at round prices break every one of those assumptions.
The Polymarket-v1 archive makes this concrete: tick-rule accuracy of 49.83% is not a rounding error or a data-quality problem. It is a structural property of the market. Any research pipeline that ignores this and uses heuristic direction will produce metrics that look coherent in isolation but are systematically biased in ways that only become visible when you compare them to ground truth.
The practical implication is that the barrier to doing this correctly is lower than it appears. The settlement-layer data is public. The reconstruction logic is straightforward once you have the right archive. The hard part is knowing that the problem exists in the first place, and then building the discipline to validate every derived metric against ground truth before trusting it.
Cross-venue normalization adds a second layer of complexity that most single-venue analyses skip entirely. A Smart Money wallet active on both Polymarket and Kalshi looks like two separate actors in a single-venue dataset. The signal from their combined position is stronger than either venue shows alone. That is the analytical gap that unified intelligence platforms are designed to close.
Assymetrix gives you unified Polymarket data without the integration overhead
The problems this article covers — ground-truth trade direction, normalized schemas, cross-venue wallet tracking, and reproducible bulk exports — are exactly what Assymetrix is built to solve. Rather than maintaining separate ingestion pipelines for Polymarket, Kalshi, and Limitless, you get a single real-time and historical data API with consistent field names, settlement-verified maker/taker flags, and L2 reconstruction already done.
The platform surfaces Smart Money wallet tracking, Trader Skill Scores, and cross-venue arbitrage signals on top of approximately 1.5 TB of historical data spanning nearly one billion rows of trading activity. Bulk Parquet exports are available for backtesting pipelines, and Python SDK examples cover everything from streaming ingestion to per-wallet skill score computation. For researchers building reproducible backtesting workflows, Assymetrix offers non-commercial and academic tiers alongside commercial licenses for production deployments. Start at data.assymetrix.com to review available tiers and request API access.
Useful sources and datasets to consult next
Primary datasets and archives:
Polymarket-v1 archive (arXiv) — 1.2 billion trades across 1.3 million markets, $61 billion nominal volume, ground-truth direction, the authoritative benchmark for heuristic validation. Read this first.
SII-WANGZJ/Polymarket_data (GitHub) — 1.1 billion records in five analysis-ready Parquet formats including
quant.parquetandusers.parquet. Useful for behavioral and ML research.19.1 million snapshot archive (DEV Community) — 15-minute cadence across ~19,000 resolved markets; best for calibration and time-to-resolution analysis.
Documentation and integration guides:
Assymetrix Data API guide — real-time and historical endpoints, schema reference, and rate-limit specs.
Python SDK examples — ingestion code, wallet analytics, and signal computation notebooks.
Backtesting guide with 200M+ snapshots — reproducible experiment templates and API integration examples.
Recommended reading order: Start with the Polymarket-v1 archive paper to understand ground-truth direction and heuristic failure modes. Then read the ingestion documentation for your chosen data source. Then run the calibration and time-to-resolution analyses on a small resolved-market sample before building any live signal.
Citing datasets: When publishing research that uses the Polymarket-v1 archive or community Parquet datasets, cite the specific dataset version and the date of your export snapshot. For large archived Parquet exports, contact the dataset maintainers directly for access terms and versioning information.
FAQ
What is the most reliable source for Polymarket trade direction?
The Polymarket-v1 archive provides ground-truth buyer/seller direction derived from on-chain settlement records across 1.2 billion trades. Tick-rule heuristics achieve only ~50% accuracy on Polymarket and should not be used for OFI or VPIN computation.
How do you identify Smart Money wallets on Polymarket?
Filter for wallets with positive Brier score improvement versus the market baseline over at least 20 resolved markets, combined with above-median directional OFI contribution. Apply a minimum-market threshold and normalize by ticket size to control for capital-size effects.
What Python tools work best for Polymarket data analysis?
Pandas and DuckDB handle most research-scale Parquet queries efficiently. For production pipelines, ClickHouse or TimescaleDB serve as the hot store, with Spark or Dask for full-history scans. The Assymetrix Python SDK provides pre-built connectors for streaming ingestion and wallet analytics.
What is the Nothing-Ever-Happens bias in Polymarket data?
It is a structural pattern where many binary contracts resolve NO more often than intuition suggests, inflating the apparent skill of wallets that systematically bet NO. Control for it by computing skill scores separately by market category and resolution direction rather than pooling all markets.
How should you validate a Polymarket trading signal before going live?
Run an out-of-sample backtest on markets resolved after your training cutoff, apply market-level bootstrap resampling for confidence intervals, and compare derived VPIN or OFI values to ground-truth values from the Polymarket-v1 archive on a held-out sample. A correlation below 0.90 between your reconstructed metrics and ground truth indicates a pipeline problem that will corrupt live signals.
Other Blog


