Order Flow Imbalance for Prediction Markets: A Quant Guide
Order Flow Imbalance for Prediction Markets: A Quant Guide
Order Flow Imbalance for Prediction Markets: A Quant Guide
Learn how to use order flow imbalance to predict short-term trends in prediction markets, enhancing your trading strategies effectively.

Order Flow Imbalance for Prediction Markets: A Quant Guide
Order flow imbalance (OFI) predicts short-horizon probability drift in prediction markets when you compute it from signed top-of-book events rather than raw trade prints alone. The canonical form sums the signed change in bid and ask depth across an interval:
OFI = Σ [ΔBid(t) · 1(bid up) − ΔBid(t) · 1(bid down)] − Σ [ΔAsk(t) · 1(ask up) − ΔAsk(t) · 1(ask down)]
A lighter trade-only variant sums signed trade volume: buyer-initiated size minus seller-initiated size per interval. Either way, the one-line recipe is the same: pull trade-level events plus L1/L2 orderbook snapshots, compute OFI over rolling windows, normalize by depth, and emit a signal when the normalized score crosses a threshold.
Data required: trade prints and top-of-book (or multi-level) snapshots, timestamp-aligned.
Lookback windows: start with 5 seconds, 30 seconds, and 5 minutes, then tune per market category.
Thresholding: emit a directional signal only when normalized OFI exceeds a z-score band, not on raw sign alone.
Pro Tip: A 30 second window that works for a liquid sports market will drown in noise on a thin political market with $200 in resting depth. Tune the window to the book, not the calendar.
Key Takeaways
Order flow imbalance predicts short-horizon probability drift in prediction markets when computed from signed top-of-book events, normalized by depth, and validated with realistic execution costs.
Point | Details |
|---|---|
Use signed events, not just trades | Full OFI counts limit adds and cancels at the touch, which explains price moves better than trade volume alone. |
Normalize before comparing markets | Divide by depth (NOFI) and apply a rolling z-score so thin and deep books are comparable. |
Tune parameters by category | Political markets generally require longer lookbacks and deeper weighting; sports markets typically need short lookbacks with emphasis on level 1. |
Guard against thin-book noise | Apply minimum depth filters and spread guards before trusting any extreme OFI reading. |
Build on unified cross-venue data | The Assymetrix Data API supplies normalized orderbook and trade feeds across Polymarket, Kalshi, and Limitless through its |
Table of Contents
How Do You Calculate Order Flow Imbalance in Prediction Markets?
How Should You Normalize and Depth-Weight OFI?
How Do You Turn OFI Into a Predictive Trading Signal?
Building Production-Ready OFI With the Assymetrix Data API
Which Market Categories Show the Most Exploitable Imbalance Patterns?
What Pitfalls Undermine OFI-Based Signals?
Quick Deployment Checklist: From Raw Feeds to a Live OFI Signal
How Does OFI Compare With Order Imbalance Ratio and Volume Imbalance?
What Technical Challenges Come With High-Frequency OFI Data?
Which Tools Handle OFI Computation Well?
How Do You Integrate OFI Into a Production Trading Pipeline?
How Should OFI Models Handle News and Event-Driven Conditions?
Sources
How Do You Calculate Order Flow Imbalance in Prediction Markets?
The formal OFI equation, following Cont, Kukanov and Stoikov, sums signed changes at the best bid and best ask across each event in an interval. Their finding still holds up as the field’s baseline: short-interval price changes are approximately linear in OFI, and the coefficient linking the two shrinks as depth grows. Thin prediction-market books, by that logic, should show a larger price response per unit of OFI than a deep Polymarket election contract with six-figure open interest.
A trade-only signed-volume variant is simpler to build first: classify each trade as buyer- or seller-initiated, sum the signed sizes, and skip the orderbook reconstruction. It is weaker than full-event OFI because it ignores limit adds and cancels at the touch, but it is a reasonable first pass when you only have trade feeds.
Trade classification is where implementations diverge. The tick rule signs a trade by comparing it to the prior trade price. The quote rule signs it by whether it executed nearer the bid or ask. The Lee-Ready algorithm blends both, defaulting to the tick rule when a trade sits exactly at the midpoint, and remains the standard reference method for inferring trade direction from public data.
Rebuilding the book from a snapshot-plus-delta feed follows a fixed sequence:
Load the initial snapshot for bid/ask price and size at each level.
Apply each delta event in timestamp order, updating price levels and their sizes.
On each trade event, classify it (Lee-Ready or quote rule) and sign the volume.
At each interval boundary, sum signed book-level changes and signed trade volume into a single OFI value.
Store the raw event, the computed mid-price, and depth at time of computation for later backtesting.
Event type | Sign convention | Prediction-market caveat |
|---|---|---|
Limit add at bid | Positive | Probability ticks can be small, so a single add can be a large share of depth |
Limit add at ask | Negative | Same tick-size sensitivity applies |
Cancel at bid | Negative | High cancel rates near resolution can mimic real selling pressure |
Trade lift (buy at ask) | Positive | Confirm against Lee-Ready classification, not just price direction |
Trade hit (sell at bid) | Negative | Watch for wash-style prints in low-volume markets |
How Should You Normalize and Depth-Weight OFI?
Raw OFI is not comparable across markets with different depth, so normalization is not optional if you plan to run one model across multiple contracts. Normalized OFI (NOFI) divides raw OFI by average top-of-book depth over the same window, putting a $50 imbalance on a thin book and a $5,000 imbalance on a deep one on the same scale. A rolling z-score, computed against a trailing window of OFI values, works better than a fixed threshold because prediction-market liquidity swings hard around news events and game time.
Depth weighting decides how much of the book beyond level one you count. A single-level sum only reads pressure at the touch; a multi-level weighted sum, discounting each additional level by a decay factor, captures resting intent deeper in the book. A simple weighted form: OFI_weighted = Σ (w_i · ΔLevel_i), where w_i decays geometrically from level 1 outward.
Set a minimum depth filter (skip intervals with less than a few dollars of resting size) to avoid divide-by-noise errors.
Apply a spread guard that suppresses signals when the bid-ask spread widens past a set multiple of its trailing average.
For most prediction-market venues, tune NOFI z-score thresholds between 1.5 and 2.5 standard deviations before treating a reading as tradable.
Use trade-only normalization for the thinnest venues where L2 snapshots are sparse or unreliable; fall back to full L1/L2 normalization once depth data is dependable.
Pro Tip: Normalize by depth before you normalize by time. A market that only refreshes its book every few seconds will produce misleading z-scores if you smooth over time first.
How Do You Turn OFI Into a Predictive Trading Signal?
A raw OFI number is not a trading signal until it is scored, filtered, and tested against realistic execution costs. Three construction choices dominate in practice: a continuous NOFI score fed directly into a regression, a discretized threshold signal that fires only past a z-score band, and a multi-horizon stack that combines OFI computed at several windows (5 seconds, 30 seconds, 5 minutes) into one feature vector.
Regime conditioning matters as much as the formula itself. Liquidity masks should suppress the signal when depth drops below your minimum filter. Volatility filters should widen thresholds during known event windows. Calendar guards should flag markets approaching resolution, where informed positioning tends to spike ahead of settlement.
Three model families cover most production use cases:
Linear regression mapping depth-normalized OFI to short-horizon mid-price (or probability) change, following the Cont, Kukanov and Stoikov framework directly.
Logistic classification predicting direction (up/down) rather than magnitude, useful when you only need a binary trade trigger.
Tree or ensemble models that combine OFI with price momentum, spread, and cross-venue divergence features for a richer signal.
Report backtest results with ROC/AUC for directional accuracy, mean return per trade net of slippage, hit rate, information ratio, and a cost-adjusted Sharpe ratio, since gross returns on a thin prediction-market book routinely look better than they perform after execution slippage. Re-estimate the impact coefficient (β) on a rolling basis, weekly at minimum, because OFI’s linear relationship is strongest within its sampling interval and decays outside it.
Building Production-Ready OFI With the Assymetrix Data API
Computing OFI in production requires two data primitives: an orderbook feed and a trade feed, both timestamped consistently. The Assymetrix Data API exposes both through /sdk/markets/:id/orderbook for live and historical book snapshots and /sdk/markets/:id/trades for trade-level events, unified across Polymarket, Kalshi, and Limitless under one schema.
Pull an initial orderbook snapshot, then subscribe to incremental deltas at your target cadence (sub-second for active markets, coarser for illiquid ones).
Pull trades from the same endpoint family and align them to the book timeline by timestamp, not by arrival order.
Run both feeds through the same reconstruction pipeline described above to compute OFI per interval.
Persist raw events, mid-price, per-level depth, and derived liquidity metrics so backtests can be rerun without re-fetching history.
Engineering checklist for a live deployment:
Confirm feed health with a heartbeat check on both endpoints before trusting a computed OFI value.
Align timestamps across venues before merging cross-venue features, since Polymarket, Kalshi, and Limitless timestamp events differently.
Run a replay environment against historical snapshots before pushing threshold changes live.
Apply the same minimum depth and spread guard rules in production that you validated in backtest.
Store high-frequency event data in a time-series store built for the volume, such as QuestDB, which handles the ingest rates typical of tick-level orderbook data.
Pro Tip: Persist the raw event stream, not just the computed OFI value. You will want to rebuild the feature with a different window or weighting scheme long after the original backtest is done, and re-deriving from summarized data never reproduces the original signal exactly.
For code-level detail on pulling and parsing these endpoints, the Python developer guide walks through request patterns and pagination for both feeds.
Which Market Categories Show the Most Exploitable Imbalance Patterns?
Political and sports markets behave differently at the order-flow level. Treating them with the same window and weighting scheme is a common source of poor signal performance. Research on market categories and imbalance dynamics shows political markets tend to build sustained directional imbalance as news filters in over hours or days, while sports markets produce sharp, short-lived spikes concentrated around game events.
Political markets: longer lookbacks (minutes to hours), deeper multi-level weighting, since informed flow often builds gradually ahead of a scheduled event or news release.
Sports markets: short lookbacks (seconds), L1-heavy weighting, since the informative window around a game-changing play is brief and closes fast.
Economic/data-release markets: hybrid approach, short lookback around the release itself, longer lookback in the run-up.
Directional order flow amid weak liquidity has been shown to amplify price movement, with Federal Reserve research on Treasury markets documenting episodes where imbalance magnitude and persistence, not just direction, explained the size of the resulting price move. The same amplification logic applies to any thin book: a persistent directional OFI reading in a low-depth market deserves more weight than the same reading in a deep one.
Spotting an exploitable condition means distinguishing a persistent directional OFI from a transient spike. The former tends to precede a real repricing; the latter is usually noise from a single large order working through a thin book.
What Pitfalls Undermine OFI-Based Signals?
Thin-book noise is the most common failure mode. A single retail-sized order in a market with a few hundred dollars of depth can swing OFI to an extreme reading that has nothing to do with informed positioning. Spoofing and resting-order churn compound this: cancels near the touch can look identical to genuine selling pressure unless you track order lifetime, not just presence.
Timestamp misalignment between the trade feed and the orderbook feed introduces subtle bias, especially when merging data across venues with different clock synchronization. And OFI’s explanatory power is a short-horizon phenomenon. Extend the holding period past the window it was estimated on, and the linear relationship between OFI and price change breaks down.
Apply a minimum depth filter before trusting any OFI reading.
Run out-of-sample tests across separate event windows, not just a single holdout period.
Simulate slippage and transaction costs explicitly rather than reporting gross returns.
Bootstrap confidence intervals around your impact coefficient (β) instead of treating a single point estimate as stable.
Test regime sensitivity by re-running the backtest across high- and low-liquidity subperiods separately.
Pro Tip: OFI is a crowded feature in mature markets. If you are running it standalone in a highly liquid Polymarket contract, expect a thinner edge than in a newer or less-covered market, and pair it with an orthogonal input rather than trading it alone.
Quick Deployment Checklist: From Raw Feeds to a Live OFI Signal
Ingest and reconstruct the L2 book from snapshot-plus-delta events.
Align trade and orderbook timestamps before merging feeds.
Compute OFI across your chosen windows (start with 5s, 30s, 5min).
Normalize by depth (NOFI) and apply a rolling z-score.
Set thresholds per market category and backtest with a realistic execution model.
Deploy to a scoring service with logging on every computed value.
Add monitoring and fallback rules before going live.
Monitor feed health continuously on both the orderbook and trades endpoints.
Log spread guard trips as a leading indicator of degraded book quality.
Run an unusual-imbalance spike detector to flag readings well outside historical norms.
Schedule daily re-calibration alerts so the impact coefficient never drifts silently stale.
How Does OFI Compare With Order Imbalance Ratio and Volume Imbalance?
Order-book imbalance is a snapshot metric: the ratio of resting bid depth to resting ask depth at a single instant, or across a few levels. It tells you where the book is lopsided right now. Order flow imbalance is the movie version of that same picture. It is the running sum of book-changing events over an interval rather than a single frame, and that distinction is why OFI tends to explain immediate price moves better than a static snapshot does.
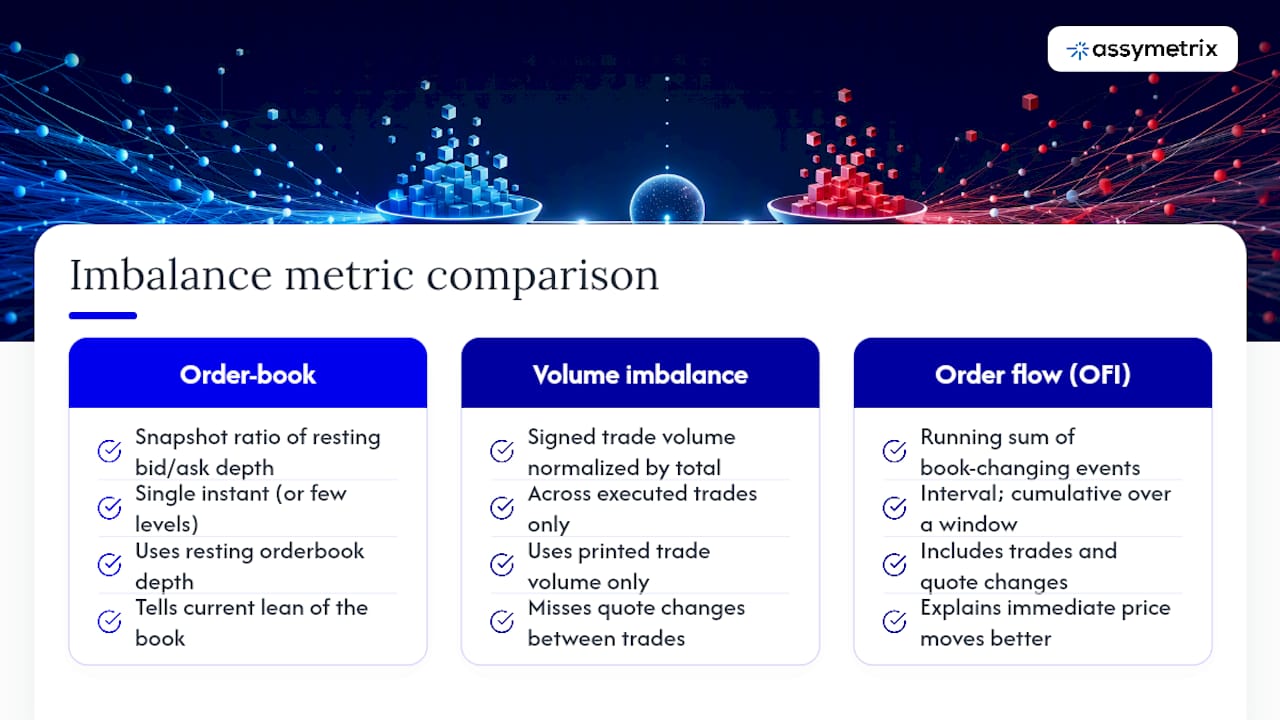
Volume imbalance (sometimes called the order imbalance ratio) usually refers to signed trade volume alone: buy volume minus sell volume, normalized by total volume. It is simpler to compute than full OFI because it skips the orderbook entirely, but it misses everything happening at the quotes between trades. A market can show heavy one-sided limit order cancellation and resting-size buildup with zero trades printing, and volume imbalance would read flat while OFI would already show directional pressure.
In practice, the three metrics answer different questions. Order-book imbalance tells you the current lean of the book. Volume imbalance tells you which side has been more aggressive in completed trades. OFI tells you the net directional pressure from everything happening at the top of book, trades and quote changes combined. For prediction markets specifically, where quote activity often outpaces trade activity by a wide margin (traders adjust limit orders around news well before anyone crosses the spread), relying on volume imbalance alone means missing most of the signal. A useful validation step is checking OFI extremes against a static order-book imbalance reading. If the two disagree sharply, investigate before trusting the OFI signal, since it may reflect transient churn rather than durable pressure.
What Technical Challenges Come With High-Frequency OFI Data?
Tick-level orderbook and trade data for even a moderately active prediction market generates a meaningful volume of events per day once you’re tracking every level update, cancel, and trade across multiple venues. The first challenge is throughput: a naive database write pattern that works for hourly candles falls over fast when you’re inserting book deltas at sub-second cadence across dozens of markets simultaneously.
The second challenge is timestamp precision. Cross-venue OFI aggregation, comparing flow on a Polymarket market against a related Kalshi contract, requires timestamps aligned to a common clock, and small clock drift between feeds introduces spurious lead-lag artifacts that look like predictive signal but are actually just clock skew.
The third is storage and query pattern. Backtesting a threshold change means replaying months of tick data repeatedly, and a relational database built for transactional workloads is the wrong tool for that access pattern. Time-series-native stores such as QuestDB handle high-cardinality, high-frequency writes and the range-scan query patterns backtesting needs far better than a general-purpose SQL database tuned for OLTP workloads.
The fourth is memory management during book reconstruction. Holding a full multi-level book in memory for every active market, updated on every delta, requires careful data structure choices, typically a sorted map per side rather than a naive list, to keep update latency low as market count scales.
Solving all four generally comes down to the same principle: treat orderbook and trade data as an append-only event log, reconstruct state on demand or via periodic checkpoints, and choose storage built for time-series access patterns rather than retrofitting a general-purpose database.
Which Tools Handle OFI Computation Well?
Most production OFI pipelines are built from a small set of components rather than one all-in-one library. On the storage side, QuestDB handles high-throughput tick data ingestion and the range-scan queries backtesting requires. On the data-source side, the Assymetrix Data API supplies the normalized orderbook and trade feeds across Polymarket, Kalshi, and Limitless that feed the whole pipeline, removing the need to write and maintain three separate venue integrations.
For reference implementations, the open-source leionion orderbook imbalance indicator is a useful starting point: it demonstrates L2 reconstruction, weighted multi-level imbalance, spread guards, and refill detection in working Python code rather than pseudocode alone. On the modeling side, standard Python data science tooling (pandas for event processing, scikit-learn or a gradient-boosted tree library for the classification layer) covers most needs; deep learning approaches like DeepLOB, a convolutional architecture originally built for limit order book price forecasting, are worth referencing for teams with enough labeled data and compute to justify a neural approach over a simpler regression or tree model.
For quants who want case-study framing rather than raw code, explainer resources like HFT Book’s OFI coverage and Micro Alphas are worth reading for intuition before writing a line of implementation code. The right toolchain choice depends less on finding one library that does everything and more on picking components, feed, storage, reconstruction, modeling, that each do one job well.
How Do You Integrate OFI Into a Production Trading Pipeline?
The biggest integration mistake is treating OFI as a standalone trading signal rather than one input among several. In practice, OFI works best as a feature feeding a broader model, combined with price momentum, spread, and cross-venue divergence signals, rather than a lone trigger that fires trades by itself.
Separate your research pipeline from your production pipeline explicitly. Backtest code that recomputes OFI from stored raw events should share the exact same computation logic as the live scoring service, not a reimplementation that risks drifting out of sync over time. A common production bug is a backtest that computes OFI slightly differently than the live signal, producing backtest results that never materialize live.
Version your impact coefficient (β) and threshold parameters the same way you version code. When you re-estimate β weekly, log the old and new values, the estimation window, and the market conditions at the time, so a bad re-estimation is traceable and reversible.
Build in graceful degradation. If the orderbook feed drops for a market, the pipeline should fall back to trade-only signed volume rather than emitting a stale or null signal silently. And keep human-readable logging on every signal emission: which window triggered it, what the normalized score was, and what the spread and depth looked like at that moment, since debugging a bad live trade three weeks later without that context is close to impossible.
Finally, treat signal decay as an expected operating condition, not an anomaly. Re-run your ROC/AUC and hit-rate metrics on a rolling basis and set alert thresholds for when live performance drifts meaningfully from backtest expectations.
How Should OFI Models Handle News and Event-Driven Conditions?
Prediction markets are built around discrete resolution events, which makes event-driven handling a first-class design concern rather than an edge case. A political market’s OFI behavior in the hours before a debate or a data release looks nothing like its behavior on a quiet Tuesday, and a model trained without distinguishing the two will misprice both.
The practical fix is a calendar-aware feature layer sitting alongside the raw OFI computation. Flag known event windows (scheduled announcements, game start times, earnings dates for economic markets) and either widen your z-score thresholds during those windows or route them through a separately calibrated model entirely. Treating a news window with the same threshold you use on a quiet day either misses the real signal buried in elevated noise or, worse, fires false positives on volume that isn’t informative.
Unscheduled news is harder. A sudden headline moving a political market has no calendar flag to key off of, so the practical defense is a volatility filter: when realized volatility or trade frequency spikes well past its trailing baseline, treat the market as being in an active-news regime and either suppress the standard signal or switch to a shorter, more reactive window until conditions normalize.
Resolution-adjacent behavior deserves its own handling too. As a market approaches settlement, cancel rates and last-minute repositioning often spike as informed traders lock in final views, and this can generate OFI readings that look like fresh directional information but are actually just pre-settlement noise. Building a countdown-to-resolution feature into your regime conditioning helps separate genuine late information from mechanical end-of-market churn.
A Practical Note on Where OFI Fits
OFI earns its place as an execution-grade input once it is depth-normalized and cross-checked against a static book reading, not before. It rewards markets where informed positioning shows up before price does, and it works best stacked with orthogonal signals, not run alone.
Get Production Orderbook and Trade Data From Assymetrix
Everything in this guide assumes you have clean, timestamp-aligned trade and orderbook data across venues, and that is the actual bottleneck for most teams building OFI signals. The Assymetrix Data API removes the need to build and maintain three separate venue integrations by unifying Polymarket, Kalshi, and Limitless under one normalized schema, with live L2 depth and historical replay available through the same /sdk/markets/:id/orderbook and /sdk/markets/:id/trades endpoints referenced throughout this article.

What that means in practice: no per-venue timestamp reconciliation, no separate rate-limit handling for three different APIs, and consistent field names for depth, price, and trade direction across all three venues. Developers building a first OFI prototype can start with the Python developer guide for request patterns, then move to live scoring once backtests hold up. If you’re ready to pull real orderbook and trade data instead of theorizing about it, start with the Data API guide and get your first market’s feed running today.
Sources
The Price Impact of Order Book Events (Cont, Kukanov & Stoikov)
Order flow imbalances and amplification of price movements: Evidence from U.S. Treasury markets
Order Flow Imbalance (OFI): Reading Short-Horizon Price Pressure · Micro Alphas
FAQ
How Do You Calculate Order Flow Imbalance?
Sum the signed changes in bid and ask depth at the top of book across an interval, or use a simpler trade-only variant that sums signed trade volume from buyer- versus seller-initiated trades classified with the Lee-Ready algorithm.
What Is the 3-5-7 Rule in Trading Strategy?
What Is the Difference Between an FVG and an Imbalance?
A fair value gap (FVG) is a price-chart pattern showing a gap between candle wicks where little trading occurred, while order flow imbalance is a quantitative metric built from signed orderbook and trade events. They come from different analytical traditions, technical chart reading versus microstructure modeling, and are not interchangeable.
Is a Buy-Side Imbalance Good?
A buy-side imbalance signals directional buying pressure that often precedes a short-term price increase, but whether it is “good” depends on depth, persistence, and whether it appears alongside confirming signals like static order-book imbalance rather than as an isolated spike.
Which Data Do You Need to Build an OFI Signal for Prediction Markets?
You need trade-level events and orderbook snapshots with aligned timestamps across venues; the Assymetrix Data API provides both through its /sdk/markets/:id/orderbook and /sdk/markets/:id/trades endpoints across Polymarket, Kalshi, and Limitless.
Order Flow Imbalance for Prediction Markets: A Quant Guide
Order flow imbalance (OFI) predicts short-horizon probability drift in prediction markets when you compute it from signed top-of-book events rather than raw trade prints alone. The canonical form sums the signed change in bid and ask depth across an interval:
OFI = Σ [ΔBid(t) · 1(bid up) − ΔBid(t) · 1(bid down)] − Σ [ΔAsk(t) · 1(ask up) − ΔAsk(t) · 1(ask down)]
A lighter trade-only variant sums signed trade volume: buyer-initiated size minus seller-initiated size per interval. Either way, the one-line recipe is the same: pull trade-level events plus L1/L2 orderbook snapshots, compute OFI over rolling windows, normalize by depth, and emit a signal when the normalized score crosses a threshold.
Data required: trade prints and top-of-book (or multi-level) snapshots, timestamp-aligned.
Lookback windows: start with 5 seconds, 30 seconds, and 5 minutes, then tune per market category.
Thresholding: emit a directional signal only when normalized OFI exceeds a z-score band, not on raw sign alone.
Pro Tip: A 30 second window that works for a liquid sports market will drown in noise on a thin political market with $200 in resting depth. Tune the window to the book, not the calendar.
Key Takeaways
Order flow imbalance predicts short-horizon probability drift in prediction markets when computed from signed top-of-book events, normalized by depth, and validated with realistic execution costs.
Point | Details |
|---|---|
Use signed events, not just trades | Full OFI counts limit adds and cancels at the touch, which explains price moves better than trade volume alone. |
Normalize before comparing markets | Divide by depth (NOFI) and apply a rolling z-score so thin and deep books are comparable. |
Tune parameters by category | Political markets generally require longer lookbacks and deeper weighting; sports markets typically need short lookbacks with emphasis on level 1. |
Guard against thin-book noise | Apply minimum depth filters and spread guards before trusting any extreme OFI reading. |
Build on unified cross-venue data | The Assymetrix Data API supplies normalized orderbook and trade feeds across Polymarket, Kalshi, and Limitless through its |
Table of Contents
How Do You Calculate Order Flow Imbalance in Prediction Markets?
How Should You Normalize and Depth-Weight OFI?
How Do You Turn OFI Into a Predictive Trading Signal?
Building Production-Ready OFI With the Assymetrix Data API
Which Market Categories Show the Most Exploitable Imbalance Patterns?
What Pitfalls Undermine OFI-Based Signals?
Quick Deployment Checklist: From Raw Feeds to a Live OFI Signal
How Does OFI Compare With Order Imbalance Ratio and Volume Imbalance?
What Technical Challenges Come With High-Frequency OFI Data?
Which Tools Handle OFI Computation Well?
How Do You Integrate OFI Into a Production Trading Pipeline?
How Should OFI Models Handle News and Event-Driven Conditions?
Sources
How Do You Calculate Order Flow Imbalance in Prediction Markets?
The formal OFI equation, following Cont, Kukanov and Stoikov, sums signed changes at the best bid and best ask across each event in an interval. Their finding still holds up as the field’s baseline: short-interval price changes are approximately linear in OFI, and the coefficient linking the two shrinks as depth grows. Thin prediction-market books, by that logic, should show a larger price response per unit of OFI than a deep Polymarket election contract with six-figure open interest.
A trade-only signed-volume variant is simpler to build first: classify each trade as buyer- or seller-initiated, sum the signed sizes, and skip the orderbook reconstruction. It is weaker than full-event OFI because it ignores limit adds and cancels at the touch, but it is a reasonable first pass when you only have trade feeds.
Trade classification is where implementations diverge. The tick rule signs a trade by comparing it to the prior trade price. The quote rule signs it by whether it executed nearer the bid or ask. The Lee-Ready algorithm blends both, defaulting to the tick rule when a trade sits exactly at the midpoint, and remains the standard reference method for inferring trade direction from public data.
Rebuilding the book from a snapshot-plus-delta feed follows a fixed sequence:
Load the initial snapshot for bid/ask price and size at each level.
Apply each delta event in timestamp order, updating price levels and their sizes.
On each trade event, classify it (Lee-Ready or quote rule) and sign the volume.
At each interval boundary, sum signed book-level changes and signed trade volume into a single OFI value.
Store the raw event, the computed mid-price, and depth at time of computation for later backtesting.
Event type | Sign convention | Prediction-market caveat |
|---|---|---|
Limit add at bid | Positive | Probability ticks can be small, so a single add can be a large share of depth |
Limit add at ask | Negative | Same tick-size sensitivity applies |
Cancel at bid | Negative | High cancel rates near resolution can mimic real selling pressure |
Trade lift (buy at ask) | Positive | Confirm against Lee-Ready classification, not just price direction |
Trade hit (sell at bid) | Negative | Watch for wash-style prints in low-volume markets |
How Should You Normalize and Depth-Weight OFI?
Raw OFI is not comparable across markets with different depth, so normalization is not optional if you plan to run one model across multiple contracts. Normalized OFI (NOFI) divides raw OFI by average top-of-book depth over the same window, putting a $50 imbalance on a thin book and a $5,000 imbalance on a deep one on the same scale. A rolling z-score, computed against a trailing window of OFI values, works better than a fixed threshold because prediction-market liquidity swings hard around news events and game time.
Depth weighting decides how much of the book beyond level one you count. A single-level sum only reads pressure at the touch; a multi-level weighted sum, discounting each additional level by a decay factor, captures resting intent deeper in the book. A simple weighted form: OFI_weighted = Σ (w_i · ΔLevel_i), where w_i decays geometrically from level 1 outward.
Set a minimum depth filter (skip intervals with less than a few dollars of resting size) to avoid divide-by-noise errors.
Apply a spread guard that suppresses signals when the bid-ask spread widens past a set multiple of its trailing average.
For most prediction-market venues, tune NOFI z-score thresholds between 1.5 and 2.5 standard deviations before treating a reading as tradable.
Use trade-only normalization for the thinnest venues where L2 snapshots are sparse or unreliable; fall back to full L1/L2 normalization once depth data is dependable.
Pro Tip: Normalize by depth before you normalize by time. A market that only refreshes its book every few seconds will produce misleading z-scores if you smooth over time first.
How Do You Turn OFI Into a Predictive Trading Signal?
A raw OFI number is not a trading signal until it is scored, filtered, and tested against realistic execution costs. Three construction choices dominate in practice: a continuous NOFI score fed directly into a regression, a discretized threshold signal that fires only past a z-score band, and a multi-horizon stack that combines OFI computed at several windows (5 seconds, 30 seconds, 5 minutes) into one feature vector.
Regime conditioning matters as much as the formula itself. Liquidity masks should suppress the signal when depth drops below your minimum filter. Volatility filters should widen thresholds during known event windows. Calendar guards should flag markets approaching resolution, where informed positioning tends to spike ahead of settlement.
Three model families cover most production use cases:
Linear regression mapping depth-normalized OFI to short-horizon mid-price (or probability) change, following the Cont, Kukanov and Stoikov framework directly.
Logistic classification predicting direction (up/down) rather than magnitude, useful when you only need a binary trade trigger.
Tree or ensemble models that combine OFI with price momentum, spread, and cross-venue divergence features for a richer signal.
Report backtest results with ROC/AUC for directional accuracy, mean return per trade net of slippage, hit rate, information ratio, and a cost-adjusted Sharpe ratio, since gross returns on a thin prediction-market book routinely look better than they perform after execution slippage. Re-estimate the impact coefficient (β) on a rolling basis, weekly at minimum, because OFI’s linear relationship is strongest within its sampling interval and decays outside it.
Building Production-Ready OFI With the Assymetrix Data API
Computing OFI in production requires two data primitives: an orderbook feed and a trade feed, both timestamped consistently. The Assymetrix Data API exposes both through /sdk/markets/:id/orderbook for live and historical book snapshots and /sdk/markets/:id/trades for trade-level events, unified across Polymarket, Kalshi, and Limitless under one schema.
Pull an initial orderbook snapshot, then subscribe to incremental deltas at your target cadence (sub-second for active markets, coarser for illiquid ones).
Pull trades from the same endpoint family and align them to the book timeline by timestamp, not by arrival order.
Run both feeds through the same reconstruction pipeline described above to compute OFI per interval.
Persist raw events, mid-price, per-level depth, and derived liquidity metrics so backtests can be rerun without re-fetching history.
Engineering checklist for a live deployment:
Confirm feed health with a heartbeat check on both endpoints before trusting a computed OFI value.
Align timestamps across venues before merging cross-venue features, since Polymarket, Kalshi, and Limitless timestamp events differently.
Run a replay environment against historical snapshots before pushing threshold changes live.
Apply the same minimum depth and spread guard rules in production that you validated in backtest.
Store high-frequency event data in a time-series store built for the volume, such as QuestDB, which handles the ingest rates typical of tick-level orderbook data.
Pro Tip: Persist the raw event stream, not just the computed OFI value. You will want to rebuild the feature with a different window or weighting scheme long after the original backtest is done, and re-deriving from summarized data never reproduces the original signal exactly.
For code-level detail on pulling and parsing these endpoints, the Python developer guide walks through request patterns and pagination for both feeds.
Which Market Categories Show the Most Exploitable Imbalance Patterns?
Political and sports markets behave differently at the order-flow level. Treating them with the same window and weighting scheme is a common source of poor signal performance. Research on market categories and imbalance dynamics shows political markets tend to build sustained directional imbalance as news filters in over hours or days, while sports markets produce sharp, short-lived spikes concentrated around game events.
Political markets: longer lookbacks (minutes to hours), deeper multi-level weighting, since informed flow often builds gradually ahead of a scheduled event or news release.
Sports markets: short lookbacks (seconds), L1-heavy weighting, since the informative window around a game-changing play is brief and closes fast.
Economic/data-release markets: hybrid approach, short lookback around the release itself, longer lookback in the run-up.
Directional order flow amid weak liquidity has been shown to amplify price movement, with Federal Reserve research on Treasury markets documenting episodes where imbalance magnitude and persistence, not just direction, explained the size of the resulting price move. The same amplification logic applies to any thin book: a persistent directional OFI reading in a low-depth market deserves more weight than the same reading in a deep one.
Spotting an exploitable condition means distinguishing a persistent directional OFI from a transient spike. The former tends to precede a real repricing; the latter is usually noise from a single large order working through a thin book.
What Pitfalls Undermine OFI-Based Signals?
Thin-book noise is the most common failure mode. A single retail-sized order in a market with a few hundred dollars of depth can swing OFI to an extreme reading that has nothing to do with informed positioning. Spoofing and resting-order churn compound this: cancels near the touch can look identical to genuine selling pressure unless you track order lifetime, not just presence.
Timestamp misalignment between the trade feed and the orderbook feed introduces subtle bias, especially when merging data across venues with different clock synchronization. And OFI’s explanatory power is a short-horizon phenomenon. Extend the holding period past the window it was estimated on, and the linear relationship between OFI and price change breaks down.
Apply a minimum depth filter before trusting any OFI reading.
Run out-of-sample tests across separate event windows, not just a single holdout period.
Simulate slippage and transaction costs explicitly rather than reporting gross returns.
Bootstrap confidence intervals around your impact coefficient (β) instead of treating a single point estimate as stable.
Test regime sensitivity by re-running the backtest across high- and low-liquidity subperiods separately.
Pro Tip: OFI is a crowded feature in mature markets. If you are running it standalone in a highly liquid Polymarket contract, expect a thinner edge than in a newer or less-covered market, and pair it with an orthogonal input rather than trading it alone.
Quick Deployment Checklist: From Raw Feeds to a Live OFI Signal
Ingest and reconstruct the L2 book from snapshot-plus-delta events.
Align trade and orderbook timestamps before merging feeds.
Compute OFI across your chosen windows (start with 5s, 30s, 5min).
Normalize by depth (NOFI) and apply a rolling z-score.
Set thresholds per market category and backtest with a realistic execution model.
Deploy to a scoring service with logging on every computed value.
Add monitoring and fallback rules before going live.
Monitor feed health continuously on both the orderbook and trades endpoints.
Log spread guard trips as a leading indicator of degraded book quality.
Run an unusual-imbalance spike detector to flag readings well outside historical norms.
Schedule daily re-calibration alerts so the impact coefficient never drifts silently stale.
How Does OFI Compare With Order Imbalance Ratio and Volume Imbalance?
Order-book imbalance is a snapshot metric: the ratio of resting bid depth to resting ask depth at a single instant, or across a few levels. It tells you where the book is lopsided right now. Order flow imbalance is the movie version of that same picture. It is the running sum of book-changing events over an interval rather than a single frame, and that distinction is why OFI tends to explain immediate price moves better than a static snapshot does.
Volume imbalance (sometimes called the order imbalance ratio) usually refers to signed trade volume alone: buy volume minus sell volume, normalized by total volume. It is simpler to compute than full OFI because it skips the orderbook entirely, but it misses everything happening at the quotes between trades. A market can show heavy one-sided limit order cancellation and resting-size buildup with zero trades printing, and volume imbalance would read flat while OFI would already show directional pressure.
In practice, the three metrics answer different questions. Order-book imbalance tells you the current lean of the book. Volume imbalance tells you which side has been more aggressive in completed trades. OFI tells you the net directional pressure from everything happening at the top of book, trades and quote changes combined. For prediction markets specifically, where quote activity often outpaces trade activity by a wide margin (traders adjust limit orders around news well before anyone crosses the spread), relying on volume imbalance alone means missing most of the signal. A useful validation step is checking OFI extremes against a static order-book imbalance reading. If the two disagree sharply, investigate before trusting the OFI signal, since it may reflect transient churn rather than durable pressure.
What Technical Challenges Come With High-Frequency OFI Data?
Tick-level orderbook and trade data for even a moderately active prediction market generates a meaningful volume of events per day once you’re tracking every level update, cancel, and trade across multiple venues. The first challenge is throughput: a naive database write pattern that works for hourly candles falls over fast when you’re inserting book deltas at sub-second cadence across dozens of markets simultaneously.
The second challenge is timestamp precision. Cross-venue OFI aggregation, comparing flow on a Polymarket market against a related Kalshi contract, requires timestamps aligned to a common clock, and small clock drift between feeds introduces spurious lead-lag artifacts that look like predictive signal but are actually just clock skew.
The third is storage and query pattern. Backtesting a threshold change means replaying months of tick data repeatedly, and a relational database built for transactional workloads is the wrong tool for that access pattern. Time-series-native stores such as QuestDB handle high-cardinality, high-frequency writes and the range-scan query patterns backtesting needs far better than a general-purpose SQL database tuned for OLTP workloads.
The fourth is memory management during book reconstruction. Holding a full multi-level book in memory for every active market, updated on every delta, requires careful data structure choices, typically a sorted map per side rather than a naive list, to keep update latency low as market count scales.
Solving all four generally comes down to the same principle: treat orderbook and trade data as an append-only event log, reconstruct state on demand or via periodic checkpoints, and choose storage built for time-series access patterns rather than retrofitting a general-purpose database.
Which Tools Handle OFI Computation Well?
Most production OFI pipelines are built from a small set of components rather than one all-in-one library. On the storage side, QuestDB handles high-throughput tick data ingestion and the range-scan queries backtesting requires. On the data-source side, the Assymetrix Data API supplies the normalized orderbook and trade feeds across Polymarket, Kalshi, and Limitless that feed the whole pipeline, removing the need to write and maintain three separate venue integrations.
For reference implementations, the open-source leionion orderbook imbalance indicator is a useful starting point: it demonstrates L2 reconstruction, weighted multi-level imbalance, spread guards, and refill detection in working Python code rather than pseudocode alone. On the modeling side, standard Python data science tooling (pandas for event processing, scikit-learn or a gradient-boosted tree library for the classification layer) covers most needs; deep learning approaches like DeepLOB, a convolutional architecture originally built for limit order book price forecasting, are worth referencing for teams with enough labeled data and compute to justify a neural approach over a simpler regression or tree model.
For quants who want case-study framing rather than raw code, explainer resources like HFT Book’s OFI coverage and Micro Alphas are worth reading for intuition before writing a line of implementation code. The right toolchain choice depends less on finding one library that does everything and more on picking components, feed, storage, reconstruction, modeling, that each do one job well.
How Do You Integrate OFI Into a Production Trading Pipeline?
The biggest integration mistake is treating OFI as a standalone trading signal rather than one input among several. In practice, OFI works best as a feature feeding a broader model, combined with price momentum, spread, and cross-venue divergence signals, rather than a lone trigger that fires trades by itself.
Separate your research pipeline from your production pipeline explicitly. Backtest code that recomputes OFI from stored raw events should share the exact same computation logic as the live scoring service, not a reimplementation that risks drifting out of sync over time. A common production bug is a backtest that computes OFI slightly differently than the live signal, producing backtest results that never materialize live.
Version your impact coefficient (β) and threshold parameters the same way you version code. When you re-estimate β weekly, log the old and new values, the estimation window, and the market conditions at the time, so a bad re-estimation is traceable and reversible.
Build in graceful degradation. If the orderbook feed drops for a market, the pipeline should fall back to trade-only signed volume rather than emitting a stale or null signal silently. And keep human-readable logging on every signal emission: which window triggered it, what the normalized score was, and what the spread and depth looked like at that moment, since debugging a bad live trade three weeks later without that context is close to impossible.
Finally, treat signal decay as an expected operating condition, not an anomaly. Re-run your ROC/AUC and hit-rate metrics on a rolling basis and set alert thresholds for when live performance drifts meaningfully from backtest expectations.
How Should OFI Models Handle News and Event-Driven Conditions?
Prediction markets are built around discrete resolution events, which makes event-driven handling a first-class design concern rather than an edge case. A political market’s OFI behavior in the hours before a debate or a data release looks nothing like its behavior on a quiet Tuesday, and a model trained without distinguishing the two will misprice both.
The practical fix is a calendar-aware feature layer sitting alongside the raw OFI computation. Flag known event windows (scheduled announcements, game start times, earnings dates for economic markets) and either widen your z-score thresholds during those windows or route them through a separately calibrated model entirely. Treating a news window with the same threshold you use on a quiet day either misses the real signal buried in elevated noise or, worse, fires false positives on volume that isn’t informative.
Unscheduled news is harder. A sudden headline moving a political market has no calendar flag to key off of, so the practical defense is a volatility filter: when realized volatility or trade frequency spikes well past its trailing baseline, treat the market as being in an active-news regime and either suppress the standard signal or switch to a shorter, more reactive window until conditions normalize.
Resolution-adjacent behavior deserves its own handling too. As a market approaches settlement, cancel rates and last-minute repositioning often spike as informed traders lock in final views, and this can generate OFI readings that look like fresh directional information but are actually just pre-settlement noise. Building a countdown-to-resolution feature into your regime conditioning helps separate genuine late information from mechanical end-of-market churn.
A Practical Note on Where OFI Fits
OFI earns its place as an execution-grade input once it is depth-normalized and cross-checked against a static book reading, not before. It rewards markets where informed positioning shows up before price does, and it works best stacked with orthogonal signals, not run alone.
Get Production Orderbook and Trade Data From Assymetrix
Everything in this guide assumes you have clean, timestamp-aligned trade and orderbook data across venues, and that is the actual bottleneck for most teams building OFI signals. The Assymetrix Data API removes the need to build and maintain three separate venue integrations by unifying Polymarket, Kalshi, and Limitless under one normalized schema, with live L2 depth and historical replay available through the same /sdk/markets/:id/orderbook and /sdk/markets/:id/trades endpoints referenced throughout this article.
What that means in practice: no per-venue timestamp reconciliation, no separate rate-limit handling for three different APIs, and consistent field names for depth, price, and trade direction across all three venues. Developers building a first OFI prototype can start with the Python developer guide for request patterns, then move to live scoring once backtests hold up. If you’re ready to pull real orderbook and trade data instead of theorizing about it, start with the Data API guide and get your first market’s feed running today.
Sources
The Price Impact of Order Book Events (Cont, Kukanov & Stoikov)
Order flow imbalances and amplification of price movements: Evidence from U.S. Treasury markets
Order Flow Imbalance (OFI): Reading Short-Horizon Price Pressure · Micro Alphas
FAQ
How Do You Calculate Order Flow Imbalance?
Sum the signed changes in bid and ask depth at the top of book across an interval, or use a simpler trade-only variant that sums signed trade volume from buyer- versus seller-initiated trades classified with the Lee-Ready algorithm.
What Is the 3-5-7 Rule in Trading Strategy?
What Is the Difference Between an FVG and an Imbalance?
A fair value gap (FVG) is a price-chart pattern showing a gap between candle wicks where little trading occurred, while order flow imbalance is a quantitative metric built from signed orderbook and trade events. They come from different analytical traditions, technical chart reading versus microstructure modeling, and are not interchangeable.
Is a Buy-Side Imbalance Good?
A buy-side imbalance signals directional buying pressure that often precedes a short-term price increase, but whether it is “good” depends on depth, persistence, and whether it appears alongside confirming signals like static order-book imbalance rather than as an isolated spike.
Which Data Do You Need to Build an OFI Signal for Prediction Markets?
You need trade-level events and orderbook snapshots with aligned timestamps across venues; the Assymetrix Data API provides both through its /sdk/markets/:id/orderbook and /sdk/markets/:id/trades endpoints across Polymarket, Kalshi, and Limitless.
Other Blog


