Kalshi Trading Strategies for Quants and Developers
Kalshi Trading Strategies for Quants and Developers
Kalshi Trading Strategies for Quants and Developers
Unlock successful kalshi trading strategies with a detailed guide on contract analysis, fee management, and effective order types.

Kalshi Trading Strategies for Quants and Developers
Systematic, maker-first Kalshi trading strategies built on analytically tractable contracts, fee-aware sizing, and cross-venue validation consistently outperform ad-hoc taker execution. The core claim: if your model does not survive fee and slippage accounting before you deploy it, it is not a strategy.
Immediate implementation checklist:
Prioritize limit orders. Makers net positive returns across more than 300,000 contracts analyzed; takers underperform after fees on aggregate.
Start with economic and weather contracts. Fed rate decisions, CPI releases, and named-station weather markets offer the clearest external anchors for model-market comparison.
Build fees and slippage into P&L from day one. Use fractional Kelly (half- or quarter-Kelly) for position sizing.
Backtest cross-venue before going live. The Assymetrix Data API provides approximately 1.5 TB of historical data spanning nearly one billion rows of Kalshi and Polymarket trading activity, with 200M+ price snapshots for rapid prototyping.
Pro Tip: Before writing a single line of signal code, pull the contract’s exact resolution clause and encode it as a filter. Ambiguous wording raises dispute risk and erodes statistical edge even when your directional call is correct.
Statistic: Analysis across more than 300,000 Kalshi contracts shows makers earn positive returns on average while takers consistently lose once fees and spreads are applied.
Table of Contents
How does Kalshi’s structure change your strategy design?
Which strategy categories should you test first on Kalshi?
Where do Kalshi-specific edges actually come from?
How do you backtest Kalshi strategies at scale?
How do you build the execution stack for Kalshi?
What risk controls does a live Kalshi strategy require?
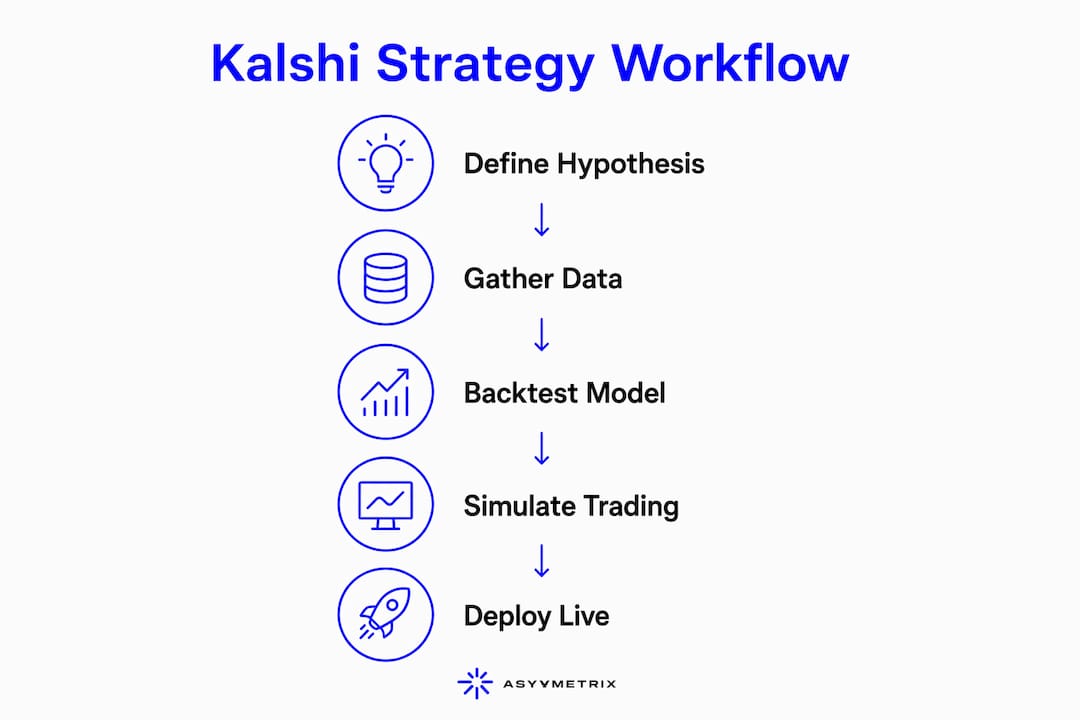
Step-by-step mean-reversion strategy workflow
How do you know if a Kalshi strategy is statistically real?
Key Takeaways
The data does not lie about what actually works
Assymetrix gives you the data layer your backtest actually needs
How does Kalshi’s structure change your strategy design?
Kalshi contracts are binary, settling to $1 (YES) or $0 (NO), with prices reflecting implied probability between $0.01 and $0.99 in penny increments. Every model you build is ultimately a probability estimator competing against that price.
CFTC regulation shapes the exchange in ways that matter operationally. Settlement governance is formal, resolution sources are named in contract language, and dispute procedures are defined. That lowers some resolution risk relative to crypto-native venues but concentrates liquidity in specific contract categories, particularly economic and political markets.
The maker/taker fee structure is the single most consequential design constraint. Near the 50¢ midpoint, taker fees can consume the entire expected edge on a marginal trade. Makers posting limit orders often recover fees through rebates; takers pay them twice on a round trip. Tick size and minimum increment set the floor on exploitable price gaps: treat the full round-trip spread as a tax in every edge calculation.
Key structural constraints to encode:
Binary $1/$0 payout; no partial settlement
Named official resolution sources per contract (encode these as filters)
Maker/taker fee differential that favors limit-order execution
Penny-increment pricing; minimum exploitable gap must exceed round-trip cost
CFTC oversight: formal dispute rules, defined contract expiry, and settlement timelines
Pro Tip: Read the resolution clause before modeling. “Highest single-day temperature at station X per NWS” and “average high temperature for the week” are different contracts with different model requirements and different dispute profiles.
Which strategy categories should you test first on Kalshi?
Ranked by analytical tractability and historical signal clarity:
Analytic economic releases (Fed, CPI, NFP). Compare Kalshi prices to CME FedWatch and consensus forecasts. Divergences of 3–5 percentage points from futures-implied probabilities are actionable signal bands. Use limit orders; these markets are liquid enough for maker fills.
Mean reversion on political overreactions. Track 7-day rolling averages; single-day moves of 15+ cents below average often reflect noise rather than fundamental repricing. Combine with a news filter to exclude genuine information shocks.
Weather-model divergence on station-defined markets. GFS and ECMWF forecasts against named NWS stations produce reproducible model-market comparisons. Resolution clarity is high when the contract names the station and source explicitly.
Sports value in thin, slow-updating markets. Edge exists where market makers are absent and prices lag public model updates. Spreads are wide; size conservatively.
Disciplined market making on niche contracts. Post two-sided quotes only when spread exceeds fee plus inventory risk. Requires real-time book monitoring and automated inventory rebalancing.
Cross-venue arbitrage (Kalshi vs. Polymarket). Apparent gaps frequently collapse once contract wording, cutoff times, and settlement sources are compared. Verify all four conditions before trading: identical wording, identical resolution source, equivalent fees, and executable prices on both legs simultaneously.
Pro Tip: Start with a falsifiable hypothesis — a specific rule that can be proven wrong. “Buy when Kalshi Fed probability is 4+ points below CME FedWatch” is testable. “Trade when the market looks wrong” is not.
Where do Kalshi-specific edges actually come from?
Three signal sources are programmatically detectable and persistent enough to build systematic rules around.

Retail mispricing shows up as longshot/favorite bias and wide spreads on low-liquidity contracts. Detect it by running expected-value tests against historical resolution rates: if a contract category resolves YES at 72% but trades at 60¢ on average, the bias is measurable and exploitable with limit orders.
Cross-market divergence is the most tractable edge for quants. Inconsistent probabilities across correlated contracts, such as a Fed rate-hold contract pricing at 68¢ while CME FedWatch implies 78%, create a clear signal. The 3–5 percentage point threshold is a practical starting band; tighten it as you model fees and fill probability.
Early Smart Money positioning appears as unusual concentration of maker liquidity or sudden order-book skewness before a price move. Assymetrix’s Smart Money wallet tracking surfaces these signals across Kalshi and Polymarket, letting you detect clustering before odds shift.
Pro Tip: Encode a resolution-clarity filter as a pre-trade gate. Any contract where the resolution source is ambiguous or the measurement methodology is undefined gets excluded automatically, regardless of apparent edge.
How do you backtest Kalshi strategies at scale?
The data model matters as much as the signal logic. A backtest without order-book snapshots, maker/taker labels, and timestamped fills is a simulation of a market that does not exist.
Required data fields per snapshot: mid price, best bid/ask, trade prints, maker/taker labels, open interest, fees, and resolved outcome. Target hundreds to thousands of comparable resolved events per strategy before drawing conclusions.
The Assymetrix Data API provides a unified normalized schema across Kalshi, Polymarket, and Limitless, with 200M+ price snapshots available for prototyping and near-1B-row coverage for robust cross-venue tests. The normalized schema means a backtest written against Kalshi data runs against Polymarket data without schema changes, which is critical for cross-venue arbitrage validation.
Strategy Category | Snapshot Interval | Min Resolved Events |
|---|---|---|
Economic releases (Fed, CPI) | 1–5 min around release | 200+ |
Political mean reversion | 15–60 min | 300+ |
Weather station divergence | 30–60 min | 150+ |
Sports thin-market value | 15–30 min | 200+ |
Cross-venue arbitrage | 1–5 min | 100+ per venue pair |
Backtesting pitfalls to avoid:
Testing without fees and realized spread
Lookahead bias from using settlement outcomes to filter entry signals
Failing to replicate exact resolution language in the settlement model
Using in-sample results only; always run walk-forward or rolling-window validation
Assuming 100% fill rate; model partial fills and queue position for limit orders
How do you build the execution stack for Kalshi?
The reference architecture has four layers: signal (models or AI agents) → risk and sizing (fractional Kelly plus hard caps) → execution (limit-order engine with maker quoting) → monitoring and kill switches. Assymetrix feeds the signal layer as the normalized data source.
Numbered build sequence:
Instrument the data feed: subscribe to Assymetrix snapshots for real-time book state and historical replay.
Build the signal layer: compute model-implied probability minus market mid; apply edge threshold filter.
Add the risk layer: fractional Kelly sizing with per-trade cap (2–5% of Kalshi bankroll) and portfolio exposure cap (25–30%).
Build the execution layer: limit-order engine with maker quoting; taker-only path for breaking-news triggers.
Add monitoring: reconciliation loop, latency alerting, order-state machine, and a hard daily loss limit as a kill switch.
Rate-limit discipline matters. Design snapshot polling and order placement cadence to stay within Kalshi’s REST and websocket limits; use smart batching for book polling. For AI-driven execution workflows, integrating model outputs with a structured order router reduces latency and enforces sizing rules automatically.
Pro Tip: Run a simulated fill model in paper-trading mode for at least two weeks before live deployment. Log every would-be order with entry price, model probability, market probability, and fill assumption. If the paper record cannot explain every entry in plain English, the rule is not ready.
What risk controls does a live Kalshi strategy require?
Position sizing is the first line of defense. Use half- or quarter-Kelly adjusted for model uncertainty; the full-Kelly fraction is almost always too aggressive for prediction markets where model error is non-trivial. Cap individual trades at 2–5% of your Kalshi bankroll and total portfolio exposure at 25–30%.
Transaction-cost accounting formula:
Edge after costs = (hit_rate × avg_win) − ((1 − hit_rate) × avg_loss) − round_trip_fee − avg_realized_spread
A pre-cost edge that ignores fees is not an edge. Report this number for every strategy before scaling.
Operational checklist before live launch:
Pre-trade contract resolution verification (automated clause check)
Hard daily loss limit with automatic position halt
Human-override kill switch accessible outside the trading process
Latency alerting on data feed and order acknowledgment
Daily reconciliation against Kalshi account state
Backup data feed (Assymetrix historical vs. live stream) for failover
Pro Tip: Correlated positions are the hidden risk. Ten contracts that all pay out if the economy weakens are not ten independent bets. Track correlation across open positions and cap total exposure to any single macro factor.
Step-by-step mean-reversion strategy workflow
Parameters:
Parameter | Example Value |
|---|---|
Snapshot interval | 15 min |
Min open interest | 500 contracts |
Edge threshold (after fees) | >6 cents |
Fee model | Round-trip: 2¢ per contract |
Kelly fraction | 0.5 |
Entry window | 7–10 PM ET |
Exit target | 7-day rolling average or resolution |
Numbered workflow:
Pull 15-minute snapshots from Assymetrix for target contract category (political mean reversion).
Compute 7-day rolling average mid price per contract.
Calculate signal:
signal = rolling_avg − current_mid.Filter: signal > 6¢ after subtracting round-trip fee; open interest > 500.
Size position using half-Kelly on estimated edge.
Place limit maker order at
current_ask − 1 tickduring evening window (7–10 PM ET).Set partial take-profit at rolling average; full exit at resolution or hard stop 10¢ below entry.
Log: entry price, model probability, market probability, fill type, P&L.
# Pseudocode: mean-reversion signal loop
for contract in active_contracts:
    snaps = api.get_snapshots(contract.id, interval="15min", lookback="7d")
    rolling_avg = mean([s.mid for s in snaps])
    current_mid = snaps[-1].mid
    signal = rolling_avg - current_mid
    edge_after_fees = signal - ROUND_TRIP_FEE
    if edge_after_fees > EDGE_THRESHOLD and contract.open_interest > MIN_OI:
        size = half_kelly(edge=edge_after_fees, bankroll=BANKROLL)
        place_limit_order(contract, side="YES", price=snaps[-1].ask - TICK, qty=size)
# Pseudocode: mean-reversion signal loop
for contract in active_contracts:
    snaps = api.get_snapshots(contract.id, interval="15min", lookback="7d")
    rolling_avg = mean([s.mid for s in snaps])
    current_mid = snaps[-1].mid
    signal = rolling_avg - current_mid
    edge_after_fees = signal - ROUND_TRIP_FEE
    if edge_after_fees > EDGE_THRESHOLD and contract.open_interest > MIN_OI:
        size = half_kelly(edge=edge_after_fees, bankroll=BANKROLL)
        place_limit_order(contract, side="YES", price=snaps[-1].ask - TICK, qty=size)
Pro Tip: Fix a random seed and define walk-forward split dates before running any backtest. Store all snapshots used in the run. Reproducibility is not optional when you are deciding whether to deploy real capital.
How do you know if a Kalshi strategy is statistically real?
Core metrics to report:
Edge after fees (mean expected value per trade)
Hit rate vs. market-implied probability (the gap is your signal quality)
Average realized spread cost
Profit factor (gross profit / gross loss)
Sharpe-like ratio adapted for binary payouts
Information coefficient (IC) between model probability and resolution outcome
Statistical validation checklist:
Bootstrap the edge distribution; confirm the mean is positive at 95% confidence.
Run a p-value test on out-of-sample hit rate vs. market-implied probability.
Compute confidence intervals on Kelly fractions; wide intervals mean insufficient sample size.
Perform sensitivity analysis: does edge survive a 50% increase in assumed fees?
Split by regime (high-volume vs. low-volume periods) to check for overfitting to a single market condition.
Run correlation analysis across all open positions to detect hidden concentration.
Statistic: A profitable sample of 50 trades is not a reason to scale. Validate on unseen markets, include all costs, and inspect drawdowns before increasing exposure.
Practical reporting should include: sample size, snapshot frequency, in-sample and out-of-sample date windows, and trade-level attribution showing which contract categories drive returns. Prediction market accuracy research provides calibration benchmarks useful for sanity-checking model probability estimates against historical resolution rates.
Key Takeaways
Systematic Kalshi trading strategies require fee-aware backtesting, maker-first execution, and cross-venue validation before any live deployment.
Point | Details |
|---|---|
Maker execution is the baseline | Analysis of 300,000+ contracts shows makers net positive returns; takers underperform after fees on aggregate. |
Fee accounting is non-negotiable | Subtract round-trip fees and realized spread before claiming any edge; pre-cost edges frequently turn negative. |
Start with tractable contracts | Fed, CPI, and named-station weather markets offer external anchors and clear resolution language for model-market comparison. |
Walk-forward validation required | In-sample results alone are insufficient; use rolling-window or walk-forward splits and report out-of-sample edge after costs. |
Assymetrix Data API | Provides 200M+ price snapshots and a unified Kalshi/Polymarket/Limitless schema for reproducible cross-venue backtests. |
The data does not lie about what actually works
Most Kalshi strategy guides stop at the signal. The data says the signal is the easy part. When you run systematic tests across hundreds of resolved contracts, the performance gap between pre-cost and post-cost edge is the single most consistent finding. Strategies that look clean in a naive backtest often lose 30–50% of their apparent edge once realistic fees, spread, and partial fills are modeled in.
The second lesson from cross-venue analysis: false arbitrage is everywhere. Contracts that look equivalent across Kalshi and Polymarket frequently differ in cutoff time, resolution source, or settlement methodology. The cross-venue prediction market landscape is more fragmented than it appears from the surface. Unified normalized data is not a convenience; it is the only way to verify equivalence before committing capital.
The third lesson is the most practical: resolution language is alpha. Contracts with unambiguous, machine-readable settlement criteria produce cleaner backtests, lower dispute rates, and more reliable signal attribution. Filtering on resolution clarity before modeling is the highest-return preprocessing step most quants skip.
Assymetrix gives you the data layer your backtest actually needs
Backtesting Kalshi strategies without order-book-level snapshots is guesswork. Assymetrix provides a unified data feed across Kalshi, Polymarket, and Limitless, normalized into a single schema with maker/taker labels, fill-replay support, and Smart Money wallet signals built in.

The Assymetrix Data API gives developers and quants direct access to 200M+ price snapshots, bulk export options, trader skill leaderboards, and cross-venue arbitrage signals, all from a single integration point at data.assymetrix.com. Whether you are running a mean-reversion backtest on Fed contracts or scanning for Smart Money positioning before odds shift, the data infrastructure is already built. Start with the API documentation at data.assymetrix.com to access trial tiers and schema references.
FAQ
What makes Kalshi different from crypto prediction markets for strategy design?
Kalshi is CFTC-regulated with formal settlement governance, named resolution sources, and defined dispute procedures. This lowers resolution ambiguity but concentrates liquidity in specific contract categories compared to crypto-native venues.
Do maker limit orders actually outperform on Kalshi?
Yes. Analysis across more than 300,000 contracts shows makers earn positive returns on average while takers consistently underperform once fees and spreads are applied.
How many resolved contracts do I need to validate a Kalshi strategy?
Target at least 150–300 comparable resolved events per strategy category, with walk-forward out-of-sample validation. Fifty trades is insufficient to distinguish edge from variance.
How does the Assymetrix Data API support Kalshi backtesting?
Assymetrix provides 200M+ price snapshots with a unified normalized schema across Kalshi, Polymarket, and Limitless, including maker/taker labels and bulk export for reproducible cross-venue backtests.
What is the most common reason Kalshi strategies fail in live trading?
Fee drag. A strategy that shows positive expected value before transaction costs frequently turns negative once round-trip fees and realized spread are subtracted, particularly for taker-executed trades near the 50¢ midpoint.
Kalshi Trading Strategies for Quants and Developers
Systematic, maker-first Kalshi trading strategies built on analytically tractable contracts, fee-aware sizing, and cross-venue validation consistently outperform ad-hoc taker execution. The core claim: if your model does not survive fee and slippage accounting before you deploy it, it is not a strategy.
Immediate implementation checklist:
Prioritize limit orders. Makers net positive returns across more than 300,000 contracts analyzed; takers underperform after fees on aggregate.
Start with economic and weather contracts. Fed rate decisions, CPI releases, and named-station weather markets offer the clearest external anchors for model-market comparison.
Build fees and slippage into P&L from day one. Use fractional Kelly (half- or quarter-Kelly) for position sizing.
Backtest cross-venue before going live. The Assymetrix Data API provides approximately 1.5 TB of historical data spanning nearly one billion rows of Kalshi and Polymarket trading activity, with 200M+ price snapshots for rapid prototyping.
Pro Tip: Before writing a single line of signal code, pull the contract’s exact resolution clause and encode it as a filter. Ambiguous wording raises dispute risk and erodes statistical edge even when your directional call is correct.
Statistic: Analysis across more than 300,000 Kalshi contracts shows makers earn positive returns on average while takers consistently lose once fees and spreads are applied.
Table of Contents
How does Kalshi’s structure change your strategy design?
Which strategy categories should you test first on Kalshi?
Where do Kalshi-specific edges actually come from?
How do you backtest Kalshi strategies at scale?
How do you build the execution stack for Kalshi?
What risk controls does a live Kalshi strategy require?
Step-by-step mean-reversion strategy workflow
How do you know if a Kalshi strategy is statistically real?
Key Takeaways
The data does not lie about what actually works
Assymetrix gives you the data layer your backtest actually needs
How does Kalshi’s structure change your strategy design?
Kalshi contracts are binary, settling to $1 (YES) or $0 (NO), with prices reflecting implied probability between $0.01 and $0.99 in penny increments. Every model you build is ultimately a probability estimator competing against that price.
CFTC regulation shapes the exchange in ways that matter operationally. Settlement governance is formal, resolution sources are named in contract language, and dispute procedures are defined. That lowers some resolution risk relative to crypto-native venues but concentrates liquidity in specific contract categories, particularly economic and political markets.
The maker/taker fee structure is the single most consequential design constraint. Near the 50¢ midpoint, taker fees can consume the entire expected edge on a marginal trade. Makers posting limit orders often recover fees through rebates; takers pay them twice on a round trip. Tick size and minimum increment set the floor on exploitable price gaps: treat the full round-trip spread as a tax in every edge calculation.
Key structural constraints to encode:
Binary $1/$0 payout; no partial settlement
Named official resolution sources per contract (encode these as filters)
Maker/taker fee differential that favors limit-order execution
Penny-increment pricing; minimum exploitable gap must exceed round-trip cost
CFTC oversight: formal dispute rules, defined contract expiry, and settlement timelines
Pro Tip: Read the resolution clause before modeling. “Highest single-day temperature at station X per NWS” and “average high temperature for the week” are different contracts with different model requirements and different dispute profiles.
Which strategy categories should you test first on Kalshi?
Ranked by analytical tractability and historical signal clarity:
Analytic economic releases (Fed, CPI, NFP). Compare Kalshi prices to CME FedWatch and consensus forecasts. Divergences of 3–5 percentage points from futures-implied probabilities are actionable signal bands. Use limit orders; these markets are liquid enough for maker fills.
Mean reversion on political overreactions. Track 7-day rolling averages; single-day moves of 15+ cents below average often reflect noise rather than fundamental repricing. Combine with a news filter to exclude genuine information shocks.
Weather-model divergence on station-defined markets. GFS and ECMWF forecasts against named NWS stations produce reproducible model-market comparisons. Resolution clarity is high when the contract names the station and source explicitly.
Sports value in thin, slow-updating markets. Edge exists where market makers are absent and prices lag public model updates. Spreads are wide; size conservatively.
Disciplined market making on niche contracts. Post two-sided quotes only when spread exceeds fee plus inventory risk. Requires real-time book monitoring and automated inventory rebalancing.
Cross-venue arbitrage (Kalshi vs. Polymarket). Apparent gaps frequently collapse once contract wording, cutoff times, and settlement sources are compared. Verify all four conditions before trading: identical wording, identical resolution source, equivalent fees, and executable prices on both legs simultaneously.
Pro Tip: Start with a falsifiable hypothesis — a specific rule that can be proven wrong. “Buy when Kalshi Fed probability is 4+ points below CME FedWatch” is testable. “Trade when the market looks wrong” is not.
Where do Kalshi-specific edges actually come from?
Three signal sources are programmatically detectable and persistent enough to build systematic rules around.
Retail mispricing shows up as longshot/favorite bias and wide spreads on low-liquidity contracts. Detect it by running expected-value tests against historical resolution rates: if a contract category resolves YES at 72% but trades at 60¢ on average, the bias is measurable and exploitable with limit orders.
Cross-market divergence is the most tractable edge for quants. Inconsistent probabilities across correlated contracts, such as a Fed rate-hold contract pricing at 68¢ while CME FedWatch implies 78%, create a clear signal. The 3–5 percentage point threshold is a practical starting band; tighten it as you model fees and fill probability.
Early Smart Money positioning appears as unusual concentration of maker liquidity or sudden order-book skewness before a price move. Assymetrix’s Smart Money wallet tracking surfaces these signals across Kalshi and Polymarket, letting you detect clustering before odds shift.
Pro Tip: Encode a resolution-clarity filter as a pre-trade gate. Any contract where the resolution source is ambiguous or the measurement methodology is undefined gets excluded automatically, regardless of apparent edge.
How do you backtest Kalshi strategies at scale?
The data model matters as much as the signal logic. A backtest without order-book snapshots, maker/taker labels, and timestamped fills is a simulation of a market that does not exist.
Required data fields per snapshot: mid price, best bid/ask, trade prints, maker/taker labels, open interest, fees, and resolved outcome. Target hundreds to thousands of comparable resolved events per strategy before drawing conclusions.
The Assymetrix Data API provides a unified normalized schema across Kalshi, Polymarket, and Limitless, with 200M+ price snapshots available for prototyping and near-1B-row coverage for robust cross-venue tests. The normalized schema means a backtest written against Kalshi data runs against Polymarket data without schema changes, which is critical for cross-venue arbitrage validation.
Strategy Category | Snapshot Interval | Min Resolved Events |
|---|---|---|
Economic releases (Fed, CPI) | 1–5 min around release | 200+ |
Political mean reversion | 15–60 min | 300+ |
Weather station divergence | 30–60 min | 150+ |
Sports thin-market value | 15–30 min | 200+ |
Cross-venue arbitrage | 1–5 min | 100+ per venue pair |
Backtesting pitfalls to avoid:
Testing without fees and realized spread
Lookahead bias from using settlement outcomes to filter entry signals
Failing to replicate exact resolution language in the settlement model
Using in-sample results only; always run walk-forward or rolling-window validation
Assuming 100% fill rate; model partial fills and queue position for limit orders
How do you build the execution stack for Kalshi?
The reference architecture has four layers: signal (models or AI agents) → risk and sizing (fractional Kelly plus hard caps) → execution (limit-order engine with maker quoting) → monitoring and kill switches. Assymetrix feeds the signal layer as the normalized data source.
Numbered build sequence:
Instrument the data feed: subscribe to Assymetrix snapshots for real-time book state and historical replay.
Build the signal layer: compute model-implied probability minus market mid; apply edge threshold filter.
Add the risk layer: fractional Kelly sizing with per-trade cap (2–5% of Kalshi bankroll) and portfolio exposure cap (25–30%).
Build the execution layer: limit-order engine with maker quoting; taker-only path for breaking-news triggers.
Add monitoring: reconciliation loop, latency alerting, order-state machine, and a hard daily loss limit as a kill switch.
Rate-limit discipline matters. Design snapshot polling and order placement cadence to stay within Kalshi’s REST and websocket limits; use smart batching for book polling. For AI-driven execution workflows, integrating model outputs with a structured order router reduces latency and enforces sizing rules automatically.
Pro Tip: Run a simulated fill model in paper-trading mode for at least two weeks before live deployment. Log every would-be order with entry price, model probability, market probability, and fill assumption. If the paper record cannot explain every entry in plain English, the rule is not ready.
What risk controls does a live Kalshi strategy require?
Position sizing is the first line of defense. Use half- or quarter-Kelly adjusted for model uncertainty; the full-Kelly fraction is almost always too aggressive for prediction markets where model error is non-trivial. Cap individual trades at 2–5% of your Kalshi bankroll and total portfolio exposure at 25–30%.
Transaction-cost accounting formula:
Edge after costs = (hit_rate × avg_win) − ((1 − hit_rate) × avg_loss) − round_trip_fee − avg_realized_spread
A pre-cost edge that ignores fees is not an edge. Report this number for every strategy before scaling.
Operational checklist before live launch:
Pre-trade contract resolution verification (automated clause check)
Hard daily loss limit with automatic position halt
Human-override kill switch accessible outside the trading process
Latency alerting on data feed and order acknowledgment
Daily reconciliation against Kalshi account state
Backup data feed (Assymetrix historical vs. live stream) for failover
Pro Tip: Correlated positions are the hidden risk. Ten contracts that all pay out if the economy weakens are not ten independent bets. Track correlation across open positions and cap total exposure to any single macro factor.
Step-by-step mean-reversion strategy workflow
Parameters:
Parameter | Example Value |
|---|---|
Snapshot interval | 15 min |
Min open interest | 500 contracts |
Edge threshold (after fees) | >6 cents |
Fee model | Round-trip: 2¢ per contract |
Kelly fraction | 0.5 |
Entry window | 7–10 PM ET |
Exit target | 7-day rolling average or resolution |
Numbered workflow:
Pull 15-minute snapshots from Assymetrix for target contract category (political mean reversion).
Compute 7-day rolling average mid price per contract.
Calculate signal:
signal = rolling_avg − current_mid.Filter: signal > 6¢ after subtracting round-trip fee; open interest > 500.
Size position using half-Kelly on estimated edge.
Place limit maker order at
current_ask − 1 tickduring evening window (7–10 PM ET).Set partial take-profit at rolling average; full exit at resolution or hard stop 10¢ below entry.
Log: entry price, model probability, market probability, fill type, P&L.
# Pseudocode: mean-reversion signal loop
for contract in active_contracts:
    snaps = api.get_snapshots(contract.id, interval="15min", lookback="7d")
    rolling_avg = mean([s.mid for s in snaps])
    current_mid = snaps[-1].mid
    signal = rolling_avg - current_mid
    edge_after_fees = signal - ROUND_TRIP_FEE
    if edge_after_fees > EDGE_THRESHOLD and contract.open_interest > MIN_OI:
        size = half_kelly(edge=edge_after_fees, bankroll=BANKROLL)
        place_limit_order(contract, side="YES", price=snaps[-1].ask - TICK, qty=size)
Pro Tip: Fix a random seed and define walk-forward split dates before running any backtest. Store all snapshots used in the run. Reproducibility is not optional when you are deciding whether to deploy real capital.
How do you know if a Kalshi strategy is statistically real?
Core metrics to report:
Edge after fees (mean expected value per trade)
Hit rate vs. market-implied probability (the gap is your signal quality)
Average realized spread cost
Profit factor (gross profit / gross loss)
Sharpe-like ratio adapted for binary payouts
Information coefficient (IC) between model probability and resolution outcome
Statistical validation checklist:
Bootstrap the edge distribution; confirm the mean is positive at 95% confidence.
Run a p-value test on out-of-sample hit rate vs. market-implied probability.
Compute confidence intervals on Kelly fractions; wide intervals mean insufficient sample size.
Perform sensitivity analysis: does edge survive a 50% increase in assumed fees?
Split by regime (high-volume vs. low-volume periods) to check for overfitting to a single market condition.
Run correlation analysis across all open positions to detect hidden concentration.
Statistic: A profitable sample of 50 trades is not a reason to scale. Validate on unseen markets, include all costs, and inspect drawdowns before increasing exposure.
Practical reporting should include: sample size, snapshot frequency, in-sample and out-of-sample date windows, and trade-level attribution showing which contract categories drive returns. Prediction market accuracy research provides calibration benchmarks useful for sanity-checking model probability estimates against historical resolution rates.
Key Takeaways
Systematic Kalshi trading strategies require fee-aware backtesting, maker-first execution, and cross-venue validation before any live deployment.
Point | Details |
|---|---|
Maker execution is the baseline | Analysis of 300,000+ contracts shows makers net positive returns; takers underperform after fees on aggregate. |
Fee accounting is non-negotiable | Subtract round-trip fees and realized spread before claiming any edge; pre-cost edges frequently turn negative. |
Start with tractable contracts | Fed, CPI, and named-station weather markets offer external anchors and clear resolution language for model-market comparison. |
Walk-forward validation required | In-sample results alone are insufficient; use rolling-window or walk-forward splits and report out-of-sample edge after costs. |
Assymetrix Data API | Provides 200M+ price snapshots and a unified Kalshi/Polymarket/Limitless schema for reproducible cross-venue backtests. |
The data does not lie about what actually works
Most Kalshi strategy guides stop at the signal. The data says the signal is the easy part. When you run systematic tests across hundreds of resolved contracts, the performance gap between pre-cost and post-cost edge is the single most consistent finding. Strategies that look clean in a naive backtest often lose 30–50% of their apparent edge once realistic fees, spread, and partial fills are modeled in.
The second lesson from cross-venue analysis: false arbitrage is everywhere. Contracts that look equivalent across Kalshi and Polymarket frequently differ in cutoff time, resolution source, or settlement methodology. The cross-venue prediction market landscape is more fragmented than it appears from the surface. Unified normalized data is not a convenience; it is the only way to verify equivalence before committing capital.
The third lesson is the most practical: resolution language is alpha. Contracts with unambiguous, machine-readable settlement criteria produce cleaner backtests, lower dispute rates, and more reliable signal attribution. Filtering on resolution clarity before modeling is the highest-return preprocessing step most quants skip.
Assymetrix gives you the data layer your backtest actually needs
Backtesting Kalshi strategies without order-book-level snapshots is guesswork. Assymetrix provides a unified data feed across Kalshi, Polymarket, and Limitless, normalized into a single schema with maker/taker labels, fill-replay support, and Smart Money wallet signals built in.
The Assymetrix Data API gives developers and quants direct access to 200M+ price snapshots, bulk export options, trader skill leaderboards, and cross-venue arbitrage signals, all from a single integration point at data.assymetrix.com. Whether you are running a mean-reversion backtest on Fed contracts or scanning for Smart Money positioning before odds shift, the data infrastructure is already built. Start with the API documentation at data.assymetrix.com to access trial tiers and schema references.
FAQ
What makes Kalshi different from crypto prediction markets for strategy design?
Kalshi is CFTC-regulated with formal settlement governance, named resolution sources, and defined dispute procedures. This lowers resolution ambiguity but concentrates liquidity in specific contract categories compared to crypto-native venues.
Do maker limit orders actually outperform on Kalshi?
Yes. Analysis across more than 300,000 contracts shows makers earn positive returns on average while takers consistently underperform once fees and spreads are applied.
How many resolved contracts do I need to validate a Kalshi strategy?
Target at least 150–300 comparable resolved events per strategy category, with walk-forward out-of-sample validation. Fifty trades is insufficient to distinguish edge from variance.
How does the Assymetrix Data API support Kalshi backtesting?
Assymetrix provides 200M+ price snapshots with a unified normalized schema across Kalshi, Polymarket, and Limitless, including maker/taker labels and bulk export for reproducible cross-venue backtests.
What is the most common reason Kalshi strategies fail in live trading?
Fee drag. A strategy that shows positive expected value before transaction costs frequently turns negative once round-trip fees and realized spread are subtracted, particularly for taker-executed trades near the 50¢ midpoint.