Reproducible Brier Audits for Prediction Markets and Traders
Reproducible Brier Audits for Prediction Markets and Traders
Reproducible Brier Audits for Prediction Markets and Traders
Compute, decompose, and monitor Brier scores for prediction markets. Practical code, backtests, and cross venue data to run reproducible audits.

Reproducible Brier Audits for Prediction Markets and Traders
The Brier score is the mean squared error between a predicted probability and the realized outcome, and lower values mean better calibrated forecasts. It is the standard, decomposable metric for evaluating prediction-market probabilities, because it rewards confident correct calls and penalizes confident wrong ones on a continuous 0 to 1 scale. For researchers and quants, it is the starting point for any serious accuracy audit.
TL;DR:
A Brier score near zero signifies well-calibrated and discriminative forecasts, while around 0.25 indicates no skill beyond random guessing.
Reliable discrimination on rare events requires over 1,000 samples and careful definition matching to avoid misleading scores.
Cross-venue canonicalization and comprehensive historical data are essential for accurate and reproducible Brier score audits.
Monitoring the Brier score over time and across probability bins helps detect calibration drift and model degradation in prediction markets.
Comparing scores using the Brier skill score clarifies whether market forecasts truly outperform naive baseline predictions.
AssymetrixBuild More Reproducible Market AuditsAssymetrix provides unified historical and real-time prediction market data across Polymarket, Kalshi, and Limitless through one Data API.Visit Assymetrix
Table of Contents
The Brier score formula and how it fits among scoring rules
Why Brier score works well for market evaluation
Computing Brier score: hand calculation and code
What counts as a good Brier score in prediction markets
Where Brier score misleads: rare events and sample size
Building Brier scoring into backtests and live monitoring
Cross-venue data as the backbone of reproducible Brier audits
A researcher’s take on using Brier score well
A practical next step: the Assymetrix Data API
Sources
The Brier score formula and how it fits among scoring rules
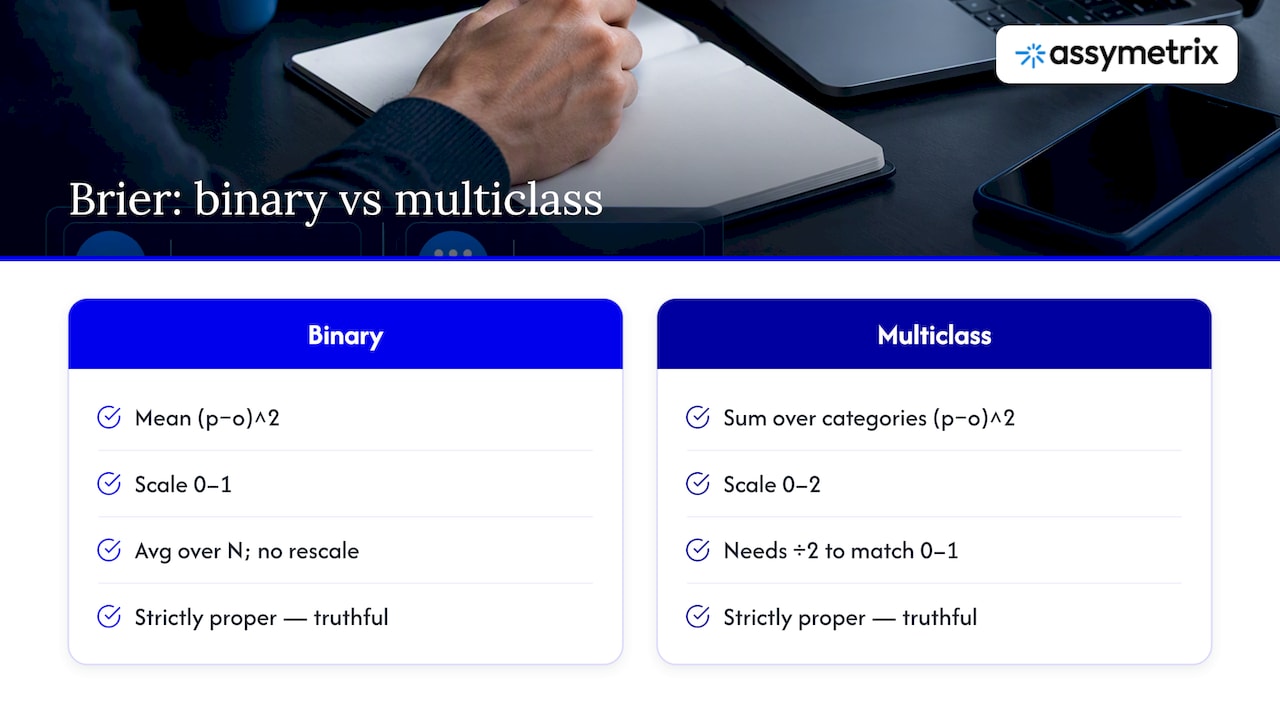
For a binary outcome, the Brier score is the mean of the squared differences between each forecast probability and the actual result, coded as 1 for the event occurring and 0 otherwise. Across N forecasts, that is the average of (forecast minus outcome) squared, which puts the score on a 0 to 1 scale where 0 is a perfect forecast and 1 is the worst possible one. This binary form already divides by N, so no further rescaling is needed for a single-outcome market.
The original multiclass formulation, as described on the Brier score Wikipedia page, sums squared errors across all possible categories rather than just one, which produces values on a 0 to 2 scale instead of 0 to 1. This is the source of a recurring confusion among developers porting code between binary and multiclass contexts: a binary score computed with the two-category sum formula needs to be divided by two to land back on the familiar 0 to 1 scale. Keeping track of which convention a library or paper uses matters more than it should, because a score of 0.3 under one convention can mean something entirely different under the other.
The Brier score belongs to the family of strictly proper scoring rules, a property discussed in depth in Buja and colleagues’ work on loss functions for binary class probability estimation. A strictly proper rule means a forecaster cannot improve their expected score by reporting anything other than their true believed probability, which is exactly the incentive structure we want when scoring market-implied probabilities rather than a model’s internal confidence. That paper also flags link-function caveats worth knowing before treating squared-error loss as interchangeable with other proper scores like log loss.
Why Brier score works well for market evaluation
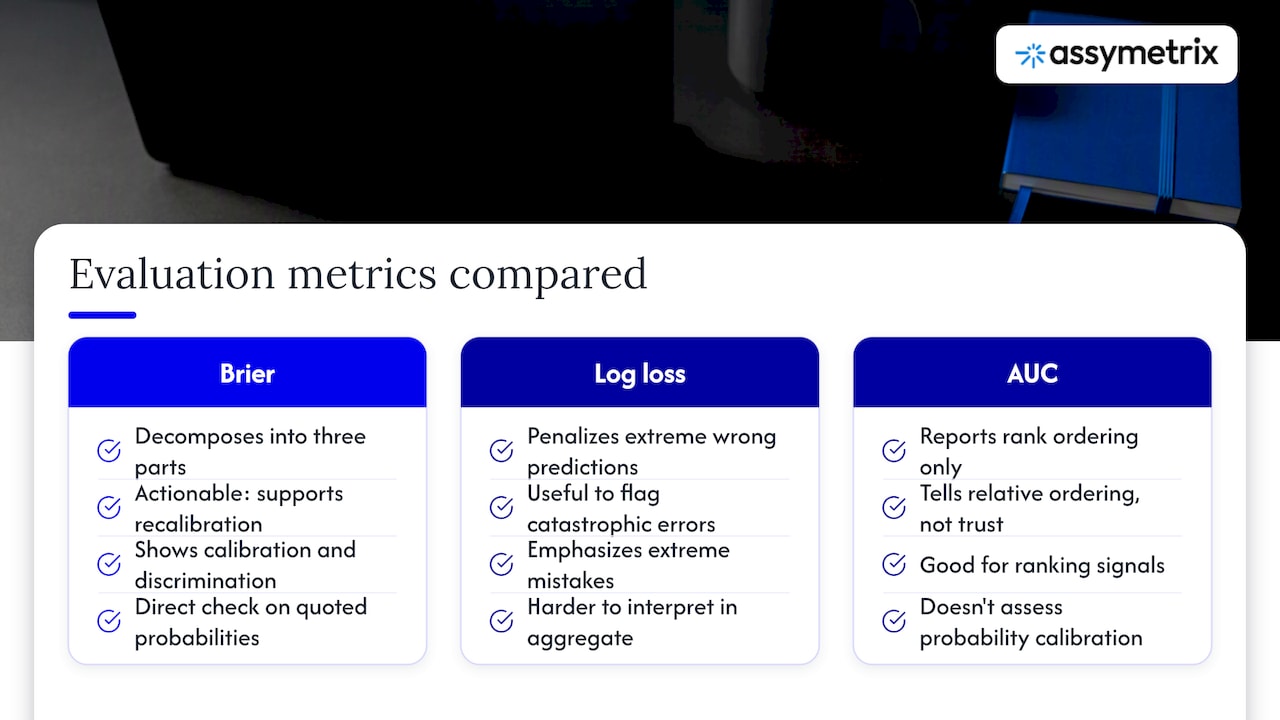
The Brier score’s main advantage over a single accuracy number is that it decomposes into three components: uncertainty, reliability, and resolution, as laid out in the Brier score decomposition literature. Uncertainty reflects the inherent variance of the outcome itself and is fixed by the base rate. Reliability captures calibration, meaning whether a market’s 70% probabilities actually resolve “yes” about 70% of the time. Resolution captures discrimination, meaning whether the market’s probabilities vary enough across events to be informative rather than hovering near the base rate for everything.
This decomposition is what makes Brier score actionable rather than descriptive. A market with poor reliability has a systemic bias correctable with recalibration. A market with poor resolution is not differentiating outcomes at all, regardless of how well-calibrated its averages look. Log loss penalizes extreme wrong predictions far more harshly, which makes it useful for flagging catastrophic miscalibration but harder to interpret in aggregate. Rank-based metrics like AUC tell you about ordering, not about whether the stated probabilities themselves are trustworthy, which is usually the question a trader actually has.
For sizing decisions, calibration is the metric that matters: a trader deciding how much capital to commit to an edge needs to trust that a market quoting 65% really does resolve “yes” close to that often, and Brier’s reliability component is the direct, decomposable check on that trust.
Computing Brier score: hand calculation and code
Consider three binary-outcome markets. Market A forecasts 0.70 for an event that occurs (outcome 1), Market B forecasts 0.40 for an event that does not occur (outcome 0), and Market C forecasts 0.90 for an event that occurs (outcome 1).
Market A: (0.70 − 1)² = 0.09
Market B: (0.40 − 0)² = 0.16
Market C: (0.90 − 1)² = 0.01
The mean of 0.09, 0.16, and 0.01 is 0.0867, which is the Brier score for this three-market sample.
For production code, scikit-learn’s brier_score_loss implements this directly:
from sklearn.metrics import brier_score_loss
y_true = [1, 0, 1]
y_proba = [0.70, 0.40, 0.90]
brier_score_loss(y_true, y_proba)
from sklearn.metrics import brier_score_loss
y_true = [1, 0, 1]
y_proba = [0.70, 0.40, 0.90]
brier_score_loss(y_true, y_proba)
This returns 0.0867, matching the hand calculation. The function includes a scale_by_half parameter controlling whether binary scores are rescaled, which matters when comparing output against papers or dashboards using the multiclass sum convention.
Pro Tip: Always confirm which scaling convention a dashboard or paper uses before comparing a Brier number across sources, since a 0 to 2 scale score will look twice as bad as the same forecast quality on a 0 to 1 scale.
The Brier skill score benchmarks a forecast against a reference, typically a naive base-rate forecast. If our three-market sample’s base rate is 2 out of 3 events occurring (0.667), a naive forecaster predicting 0.667 for every event scores (0.667−1)² + (0.667−0)² + (0.667−1)² averaged, which is 0.247.
What counts as a good Brier score in prediction markets
Markets consistently beating a naive baseline typically show measurable skill, with tighter forecasting horizons generally scoring lower (better) than longer ones, according to empirical tracking summarized on the Longterm Wiki prediction markets entry. A Brier score near 0 indicates near-perfect calibration and discrimination; a score near 0.25 is what a forecaster gets by predicting 0.5 for every binary event, meaning it reflects maximum uncertainty rather than any real skill; a score near 1 indicates confidently wrong forecasts.
Translating a raw score into a skill statement requires the Brier skill score framing introduced above. A skill score of 0% means the forecast is no better than the naive reference; 100% means perfect prediction; negative values mean the forecast is actively worse than guessing the base rate every time.
A skill score near 100% represents forecasts close to perfect resolution.
A skill score near 0% represents forecasts no better than the base rate.
A negative skill score flags a model or market actively underperforming a naive guess, worth investigating before trusting its signals.
These are illustrative figures for the calculation method, not claims about any specific market’s historical performance.
Where Brier score misleads: rare events and sample size
Reliable discrimination on rare events requires a much larger sample than common events do, with meteorological literature summarized on Wikipedia’s Brier score page indicating sample sizes well over 1,000 events are typically needed before rare-event Brier scores stabilize into something trustworthy.
Event definition mismatches compound the problem. A market resolving on a loosely worded condition, or one where the forecast horizon does not match the evaluation window, will produce a Brier score that reflects definitional noise rather than forecasting skill.
Small samples on rare events produce unstable Brier scores that shift dramatically with one or two resolutions.
Mismatched horizons, comparing a day-ahead forecast against a month-ahead outcome, inflate apparent error unrelated to skill.
Aggregating across heterogeneous event types without separating by base rate hides where the real miscalibration lives.
Mitigations include aggregating by base-rate bucket rather than pooling everything, running calibration plots across probability bins (0 to 0.1, 0.1 to 0.2, and so on) to localize miscalibration, and pairing Brier with the skill score so small-sample noise is contextualized against a reference rather than read as an absolute.
Pro Tip: Before trusting a rare-event Brier score, check the underlying event count first: fewer than a few hundred resolutions on a low base-rate category is usually too thin to draw conclusions.
Building Brier scoring into backtests and live monitoring
A reproducible Brier pipeline starts with data hygiene, since the metric is only as trustworthy as the event alignment feeding it. Canonical market IDs that persist across venues prevent the same underlying event from being double-counted when it trades on multiple platforms. Consistent resolution fields, meaning a single source of truth for how and when an event resolved, prevent silent disagreements between data sources. Snapshot cadence needs to be fixed and timestamps aligned to the evaluation horizon, not to whenever a scrape happened to run.
A practical backtest recipe follows four steps:
Align each market’s probability snapshot to the exact evaluation horizon being tested, such as 24 hours before resolution.
Compute the per-event Brier score for every aligned snapshot against its final resolved outcome.
Aggregate per-event scores by horizon bucket to see how calibration changes as events approach resolution.
Compute the Brier skill score against a naive baseline for each bucket to express the result as a skill percentage rather than a raw number.
Monitoring in production extends the same logic on a rolling basis:
Track a rolling Brier score over the trailing N resolved events rather than a single all-time aggregate.
Maintain calibration plots by probability bin to catch miscalibration concentrated in a specific range, like overconfidence above 0.8.
Weight or segment metrics by smart-money flow to see whether wallets with strong historical accuracy are associated with better-calibrated market prices.
Set alert thresholds on rolling Brier degradation so a drifting model or a stale data feed gets flagged before it silently erodes trading performance.
Compute-wise, vectorized aggregation across thousands of events outperforms row-by-row loops once a backtest spans multiple venues and horizons, and sample weighting becomes necessary when some event categories are overrepresented in a historical pull. Keeping a fixed, versioned seed dataset for any audit matters as much as the metric itself: a Brier score computed against a shifting data sample cannot be reproduced or defended later.
Pro Tip: Store the exact snapshot timestamp and canonical event ID alongside every computed Brier score, so any later audit can reproduce the number without re-querying a live feed that may have since changed.
For a structured walk-through of applying this kind of evaluation across market datasets, our prediction market accuracy guide and our backtesting guide built on large-scale price snapshots cover the alignment and aggregation steps in more detail.
Cross-venue data as the backbone of reproducible Brier audits
A Brier audit is only as reliable as the historical record feeding it, and that record has to be complete, canonical, and consistent across venues to avoid the double-counting and misalignment problems described above. We aggregate real-time and historical prediction market data across Polymarket, Kalshi, and Limitless into a unified intelligence layer, built on approximately 1.5 terabytes of historical data spanning nearly one billion rows of trading activity.
That scale matters directly for Brier work: rare-event sample-size requirements are only solvable with deep historical coverage, and cross-venue canonicalization is what prevents the same event from inflating or deflating an aggregate score when it trades in more than one place.
Canonical market IDs and resolved-outcome fields are structured for direct per-event Brier computation without manual reconciliation.
Smart Money wallet tracking and Trader Skill Scores let researchers weight or segment Brier analyses by the accuracy of the capital behind a price, not just the price itself.
Cross-venue arbitrage and market divergence signals surface where two venues disagree on the same canonical event, a useful flag before trusting either venue’s calibration in isolation.
A researcher’s take on using Brier score well
Brier score is a diagnostic, not a verdict. The number that matters is not a single aggregate but the trend of a rolling score across enough resolved events to be statistically meaningful, with clear event definitions so the denominator means what you think it means. Use it to check calibration, then pair it with a decision-focused metric, since a well-calibrated market can still offer poor risk-adjusted trading edges. Run backtests routinely rather than trusting one historical snapshot, because calibration drifts as market composition and participant behavior change.
— Dean
A practical next step: the Assymetrix Data API
Running the workflows above at scale requires canonical event IDs, full snapshot history, resolved outcomes, and Smart Money flags in one schema rather than stitched together from multiple venue APIs. Our Data API provides exactly that structure for Brier audits across Polymarket, Kalshi, and Limitless.

For a methodology comparison from outside the prediction-market space, PennyStockScout’s scoring methodology outlines a similar data-driven evaluation approach worth a look. To start building reproducible Brier pipelines on real cross-venue history, check the API documentation and example datasets at Data.
FAQ
What is considered a good Brier score?
A Brier score near 0 indicates strong calibration and discrimination, while a score near 0.25 reflects no better performance than always guessing 0.5 on a binary event. Context matters more than the raw number: comparing against a Brier skill score baseline tells you whether a given score represents real skill or just a favorable base rate.
What does Brier score calculate?
The Brier score calculates the mean squared difference between a forecast probability and the actual binary outcome, coded as 1 or 0. It is a strictly proper scoring rule, meaning a forecaster has no incentive to report anything other than their true believed probability.
Can you actually make money on prediction markets?
Trading prediction markets profitably depends on identifying mispriced probabilities relative to true outcome likelihood, which is exactly what calibration metrics like Brier score are designed to audit. Edge comes from systematically better-calibrated forecasts than the market’s current price, not from the existence of the market itself.
What are the two major prediction markets?
Polymarket and Kalshi are widely referenced as major prediction market venues, alongside platforms such as Limitless that have grown in the same space. Each venue has its own liquidity, participant base, and resolution conventions, which is part of why cross-venue canonicalization matters for any accuracy comparison.
How do you compute Brier score in Python?
Using scikit-learn, brier_score_loss takes true binary outcomes and predicted probabilities and returns the mean squared error directly. The function’s scale_by_half option controls whether the result follows the 0 to 1 binary convention or the 0 to 2 multiclass sum convention.
Sources
Reproducible Brier Audits for Prediction Markets and Traders
The Brier score is the mean squared error between a predicted probability and the realized outcome, and lower values mean better calibrated forecasts. It is the standard, decomposable metric for evaluating prediction-market probabilities, because it rewards confident correct calls and penalizes confident wrong ones on a continuous 0 to 1 scale. For researchers and quants, it is the starting point for any serious accuracy audit.
TL;DR:
A Brier score near zero signifies well-calibrated and discriminative forecasts, while around 0.25 indicates no skill beyond random guessing.
Reliable discrimination on rare events requires over 1,000 samples and careful definition matching to avoid misleading scores.
Cross-venue canonicalization and comprehensive historical data are essential for accurate and reproducible Brier score audits.
Monitoring the Brier score over time and across probability bins helps detect calibration drift and model degradation in prediction markets.
Comparing scores using the Brier skill score clarifies whether market forecasts truly outperform naive baseline predictions.
AssymetrixBuild More Reproducible Market AuditsAssymetrix provides unified historical and real-time prediction market data across Polymarket, Kalshi, and Limitless through one Data API.Visit Assymetrix
Table of Contents
The Brier score formula and how it fits among scoring rules
Why Brier score works well for market evaluation
Computing Brier score: hand calculation and code
What counts as a good Brier score in prediction markets
Where Brier score misleads: rare events and sample size
Building Brier scoring into backtests and live monitoring
Cross-venue data as the backbone of reproducible Brier audits
A researcher’s take on using Brier score well
A practical next step: the Assymetrix Data API
Sources
The Brier score formula and how it fits among scoring rules
For a binary outcome, the Brier score is the mean of the squared differences between each forecast probability and the actual result, coded as 1 for the event occurring and 0 otherwise. Across N forecasts, that is the average of (forecast minus outcome) squared, which puts the score on a 0 to 1 scale where 0 is a perfect forecast and 1 is the worst possible one. This binary form already divides by N, so no further rescaling is needed for a single-outcome market.
The original multiclass formulation, as described on the Brier score Wikipedia page, sums squared errors across all possible categories rather than just one, which produces values on a 0 to 2 scale instead of 0 to 1. This is the source of a recurring confusion among developers porting code between binary and multiclass contexts: a binary score computed with the two-category sum formula needs to be divided by two to land back on the familiar 0 to 1 scale. Keeping track of which convention a library or paper uses matters more than it should, because a score of 0.3 under one convention can mean something entirely different under the other.
The Brier score belongs to the family of strictly proper scoring rules, a property discussed in depth in Buja and colleagues’ work on loss functions for binary class probability estimation. A strictly proper rule means a forecaster cannot improve their expected score by reporting anything other than their true believed probability, which is exactly the incentive structure we want when scoring market-implied probabilities rather than a model’s internal confidence. That paper also flags link-function caveats worth knowing before treating squared-error loss as interchangeable with other proper scores like log loss.
Why Brier score works well for market evaluation
The Brier score’s main advantage over a single accuracy number is that it decomposes into three components: uncertainty, reliability, and resolution, as laid out in the Brier score decomposition literature. Uncertainty reflects the inherent variance of the outcome itself and is fixed by the base rate. Reliability captures calibration, meaning whether a market’s 70% probabilities actually resolve “yes” about 70% of the time. Resolution captures discrimination, meaning whether the market’s probabilities vary enough across events to be informative rather than hovering near the base rate for everything.
This decomposition is what makes Brier score actionable rather than descriptive. A market with poor reliability has a systemic bias correctable with recalibration. A market with poor resolution is not differentiating outcomes at all, regardless of how well-calibrated its averages look. Log loss penalizes extreme wrong predictions far more harshly, which makes it useful for flagging catastrophic miscalibration but harder to interpret in aggregate. Rank-based metrics like AUC tell you about ordering, not about whether the stated probabilities themselves are trustworthy, which is usually the question a trader actually has.
For sizing decisions, calibration is the metric that matters: a trader deciding how much capital to commit to an edge needs to trust that a market quoting 65% really does resolve “yes” close to that often, and Brier’s reliability component is the direct, decomposable check on that trust.
Computing Brier score: hand calculation and code
Consider three binary-outcome markets. Market A forecasts 0.70 for an event that occurs (outcome 1), Market B forecasts 0.40 for an event that does not occur (outcome 0), and Market C forecasts 0.90 for an event that occurs (outcome 1).
Market A: (0.70 − 1)² = 0.09
Market B: (0.40 − 0)² = 0.16
Market C: (0.90 − 1)² = 0.01
The mean of 0.09, 0.16, and 0.01 is 0.0867, which is the Brier score for this three-market sample.
For production code, scikit-learn’s brier_score_loss implements this directly:
from sklearn.metrics import brier_score_loss
y_true = [1, 0, 1]
y_proba = [0.70, 0.40, 0.90]
brier_score_loss(y_true, y_proba)
This returns 0.0867, matching the hand calculation. The function includes a scale_by_half parameter controlling whether binary scores are rescaled, which matters when comparing output against papers or dashboards using the multiclass sum convention.
Pro Tip: Always confirm which scaling convention a dashboard or paper uses before comparing a Brier number across sources, since a 0 to 2 scale score will look twice as bad as the same forecast quality on a 0 to 1 scale.
The Brier skill score benchmarks a forecast against a reference, typically a naive base-rate forecast. If our three-market sample’s base rate is 2 out of 3 events occurring (0.667), a naive forecaster predicting 0.667 for every event scores (0.667−1)² + (0.667−0)² + (0.667−1)² averaged, which is 0.247.
What counts as a good Brier score in prediction markets
Markets consistently beating a naive baseline typically show measurable skill, with tighter forecasting horizons generally scoring lower (better) than longer ones, according to empirical tracking summarized on the Longterm Wiki prediction markets entry. A Brier score near 0 indicates near-perfect calibration and discrimination; a score near 0.25 is what a forecaster gets by predicting 0.5 for every binary event, meaning it reflects maximum uncertainty rather than any real skill; a score near 1 indicates confidently wrong forecasts.
Translating a raw score into a skill statement requires the Brier skill score framing introduced above. A skill score of 0% means the forecast is no better than the naive reference; 100% means perfect prediction; negative values mean the forecast is actively worse than guessing the base rate every time.
A skill score near 100% represents forecasts close to perfect resolution.
A skill score near 0% represents forecasts no better than the base rate.
A negative skill score flags a model or market actively underperforming a naive guess, worth investigating before trusting its signals.
These are illustrative figures for the calculation method, not claims about any specific market’s historical performance.
Where Brier score misleads: rare events and sample size
Reliable discrimination on rare events requires a much larger sample than common events do, with meteorological literature summarized on Wikipedia’s Brier score page indicating sample sizes well over 1,000 events are typically needed before rare-event Brier scores stabilize into something trustworthy.
Event definition mismatches compound the problem. A market resolving on a loosely worded condition, or one where the forecast horizon does not match the evaluation window, will produce a Brier score that reflects definitional noise rather than forecasting skill.
Small samples on rare events produce unstable Brier scores that shift dramatically with one or two resolutions.
Mismatched horizons, comparing a day-ahead forecast against a month-ahead outcome, inflate apparent error unrelated to skill.
Aggregating across heterogeneous event types without separating by base rate hides where the real miscalibration lives.
Mitigations include aggregating by base-rate bucket rather than pooling everything, running calibration plots across probability bins (0 to 0.1, 0.1 to 0.2, and so on) to localize miscalibration, and pairing Brier with the skill score so small-sample noise is contextualized against a reference rather than read as an absolute.
Pro Tip: Before trusting a rare-event Brier score, check the underlying event count first: fewer than a few hundred resolutions on a low base-rate category is usually too thin to draw conclusions.
Building Brier scoring into backtests and live monitoring
A reproducible Brier pipeline starts with data hygiene, since the metric is only as trustworthy as the event alignment feeding it. Canonical market IDs that persist across venues prevent the same underlying event from being double-counted when it trades on multiple platforms. Consistent resolution fields, meaning a single source of truth for how and when an event resolved, prevent silent disagreements between data sources. Snapshot cadence needs to be fixed and timestamps aligned to the evaluation horizon, not to whenever a scrape happened to run.
A practical backtest recipe follows four steps:
Align each market’s probability snapshot to the exact evaluation horizon being tested, such as 24 hours before resolution.
Compute the per-event Brier score for every aligned snapshot against its final resolved outcome.
Aggregate per-event scores by horizon bucket to see how calibration changes as events approach resolution.
Compute the Brier skill score against a naive baseline for each bucket to express the result as a skill percentage rather than a raw number.
Monitoring in production extends the same logic on a rolling basis:
Track a rolling Brier score over the trailing N resolved events rather than a single all-time aggregate.
Maintain calibration plots by probability bin to catch miscalibration concentrated in a specific range, like overconfidence above 0.8.
Weight or segment metrics by smart-money flow to see whether wallets with strong historical accuracy are associated with better-calibrated market prices.
Set alert thresholds on rolling Brier degradation so a drifting model or a stale data feed gets flagged before it silently erodes trading performance.
Compute-wise, vectorized aggregation across thousands of events outperforms row-by-row loops once a backtest spans multiple venues and horizons, and sample weighting becomes necessary when some event categories are overrepresented in a historical pull. Keeping a fixed, versioned seed dataset for any audit matters as much as the metric itself: a Brier score computed against a shifting data sample cannot be reproduced or defended later.
Pro Tip: Store the exact snapshot timestamp and canonical event ID alongside every computed Brier score, so any later audit can reproduce the number without re-querying a live feed that may have since changed.
For a structured walk-through of applying this kind of evaluation across market datasets, our prediction market accuracy guide and our backtesting guide built on large-scale price snapshots cover the alignment and aggregation steps in more detail.
Cross-venue data as the backbone of reproducible Brier audits
A Brier audit is only as reliable as the historical record feeding it, and that record has to be complete, canonical, and consistent across venues to avoid the double-counting and misalignment problems described above. We aggregate real-time and historical prediction market data across Polymarket, Kalshi, and Limitless into a unified intelligence layer, built on approximately 1.5 terabytes of historical data spanning nearly one billion rows of trading activity.
That scale matters directly for Brier work: rare-event sample-size requirements are only solvable with deep historical coverage, and cross-venue canonicalization is what prevents the same event from inflating or deflating an aggregate score when it trades in more than one place.
Canonical market IDs and resolved-outcome fields are structured for direct per-event Brier computation without manual reconciliation.
Smart Money wallet tracking and Trader Skill Scores let researchers weight or segment Brier analyses by the accuracy of the capital behind a price, not just the price itself.
Cross-venue arbitrage and market divergence signals surface where two venues disagree on the same canonical event, a useful flag before trusting either venue’s calibration in isolation.
A researcher’s take on using Brier score well
Brier score is a diagnostic, not a verdict. The number that matters is not a single aggregate but the trend of a rolling score across enough resolved events to be statistically meaningful, with clear event definitions so the denominator means what you think it means. Use it to check calibration, then pair it with a decision-focused metric, since a well-calibrated market can still offer poor risk-adjusted trading edges. Run backtests routinely rather than trusting one historical snapshot, because calibration drifts as market composition and participant behavior change.
— Dean
A practical next step: the Assymetrix Data API
Running the workflows above at scale requires canonical event IDs, full snapshot history, resolved outcomes, and Smart Money flags in one schema rather than stitched together from multiple venue APIs. Our Data API provides exactly that structure for Brier audits across Polymarket, Kalshi, and Limitless.
For a methodology comparison from outside the prediction-market space, PennyStockScout’s scoring methodology outlines a similar data-driven evaluation approach worth a look. To start building reproducible Brier pipelines on real cross-venue history, check the API documentation and example datasets at Data.
FAQ
What is considered a good Brier score?
A Brier score near 0 indicates strong calibration and discrimination, while a score near 0.25 reflects no better performance than always guessing 0.5 on a binary event. Context matters more than the raw number: comparing against a Brier skill score baseline tells you whether a given score represents real skill or just a favorable base rate.
What does Brier score calculate?
The Brier score calculates the mean squared difference between a forecast probability and the actual binary outcome, coded as 1 or 0. It is a strictly proper scoring rule, meaning a forecaster has no incentive to report anything other than their true believed probability.
Can you actually make money on prediction markets?
Trading prediction markets profitably depends on identifying mispriced probabilities relative to true outcome likelihood, which is exactly what calibration metrics like Brier score are designed to audit. Edge comes from systematically better-calibrated forecasts than the market’s current price, not from the existence of the market itself.
What are the two major prediction markets?
Polymarket and Kalshi are widely referenced as major prediction market venues, alongside platforms such as Limitless that have grown in the same space. Each venue has its own liquidity, participant base, and resolution conventions, which is part of why cross-venue canonicalization matters for any accuracy comparison.
How do you compute Brier score in Python?
Using scikit-learn, brier_score_loss takes true binary outcomes and predicted probabilities and returns the mean squared error directly. The function’s scale_by_half option controls whether the result follows the 0 to 1 binary convention or the 0 to 2 multiclass sum convention.
Sources
Other Blog


